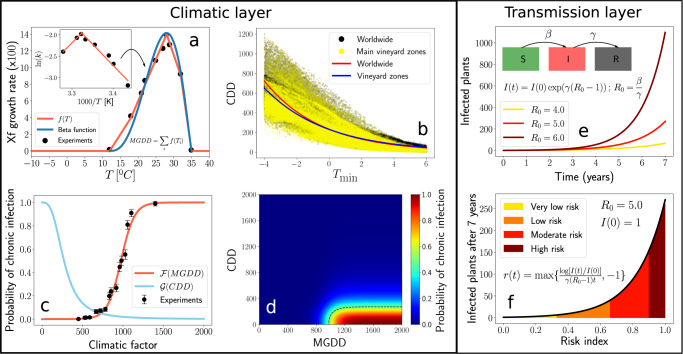
Fig. 1. Climatic and transmission layers composing the epidemiological model.
a MGDD profile fitted to the in vitro data of Xf growth rate in Feil & Purcell 200138. The original Arrhenius plot in Kelvin degrees (inset) was converted to Celsius, as explained in (Supplementary Note 2A), to obtain the fit shown in the main plot red line; the blue line represents the fit with a Beta function. b Correlation between CDD and the average of the coldest month between 1981 and 2019. Plotted black dots (worldwide) and yellow dots (main wine-producing zones) depict climatic data from 6,487,200 cells at 0.1∘ × 0.1∘ resolution, spread globally and retrieved from ERA5-Land dataset. The red solid line depicts the fitted exponential function for worldwide data and the blue solid line for main vineyard zones. c Nonlinear relationship between MGDD (red line) and CDD (blue line) and the likelihood of developing chronic infections. Black dots depict the cumulative proportion of grapevine plants in the population of 36 inoculated varieties showing five or more symptomatic leaves at each of the 15 MGDD levels (see Supplementary Information). Vertical bars are the 95% CI. d Combined ranges of MGDD and CDD on the likelihood of developing chronic infection. e Transmission layer in the dynamic equation (1) of the SIR compartmental model. f Relationship between the exponential growth of the number of infected plants with the risk index and their ranks.

