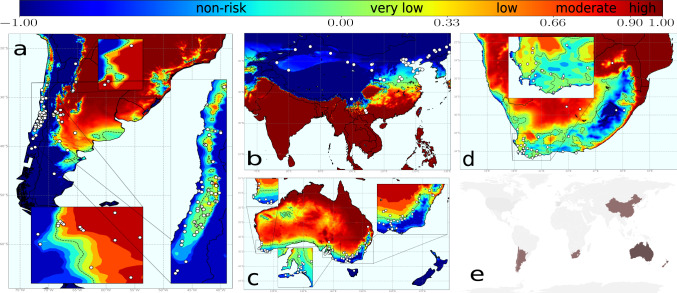
Fig. 3. Climate-driven risk maps for PD establishment in main viticulture regions worldwide under a baseline R0 = 5 scenario.
White dots indicate the main vineyard areas in the wine-growing regions of China and the Southern Hemisphere. a Chile and Argentina; b Asia with special attention to China; c Australia and New Zealand (wine areas are not marked as the whole country is without risk); and d South Africa. e Global distribution of main wine-producing areas analysed. The risk index rj(t), express the relative exponential growth rate of the disease incidence, and was scaled from 0.1 to 1 and ranked as very low (0.10–0.33), low (0.33–0.66), moderate (0.66–0.90) and high (>0.90).

