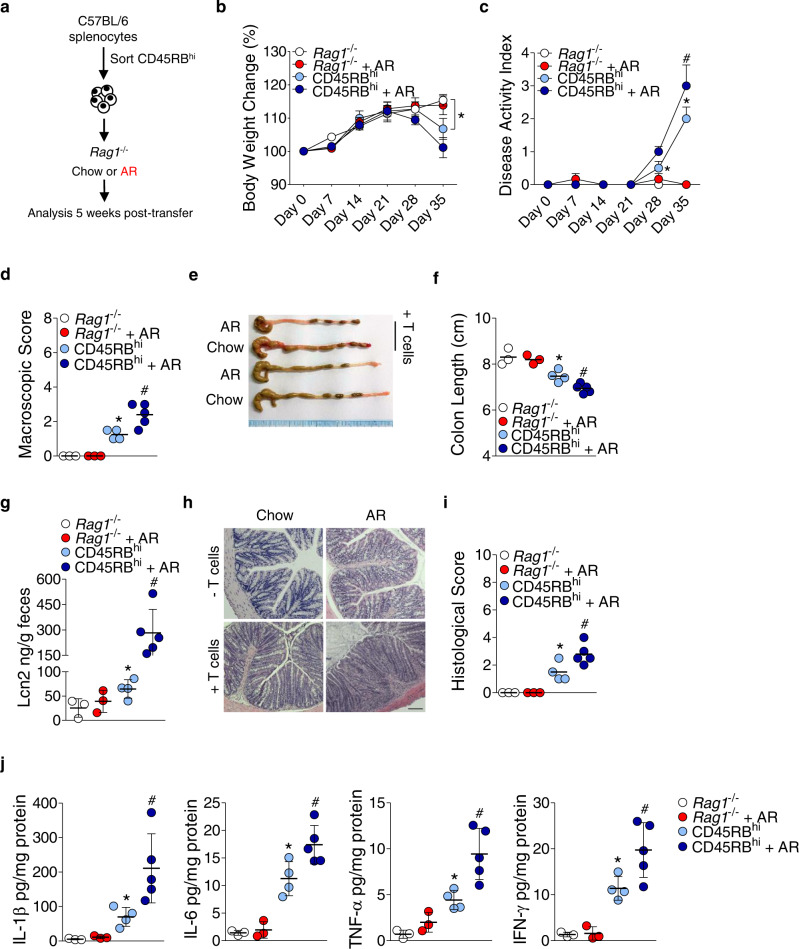
Fig. 2. AR exposure exacerbates the development of T cell-induced colitis model.
a Schematic illustration of the experimental design. Briefly, Rag1−/− mice were reconstituted with FACS-sorted CD4+CD45RBhi T cells harvested from spleens of healthy C57BL/6 mice. Rag1−/− mice were either fed normal chow diet or exposed to 100 ppm AR via diet at the time of reconstitution. b Body weight change. c Disease activity index (DAI). d Macroscopic score. e A representative image of colons. f Colon length (cm). g Fecal LCN2 levels. h Representative images of hematoxylin and eosin (H&E)-stained colonic sections; scale bar: 100 µm. i Histological score. j Colonic IL-1β, IL-6, and TNF-α, and IFN-γ levels. b, c Data were analyzed by two-way ANOVA with post hoc Bonferroni’s test and are expressed as mean ± SEM (n = 3 for Rag1−/−, and Rag1−/− + AR; n = 4 for CD45RBhi; n = 5 for CD45RBhi + AR). d–j Data were analyzed by one-way ANOVA with post hoc Bonferroni’s test and are expressed as mean or mean ± SD (n = 3 for Rag1−/−, and Rag1−/− + AR; n = 4 for CD45RBhi; n = 5 for CD45RBhi + AR). Significance denoted by *p < 0.05, #p < 0.05, where *p < 0.05 versus Rag1−/−, and #p < 0.05 versus CD45RBhi. Source data are provided as a Source Data File.

