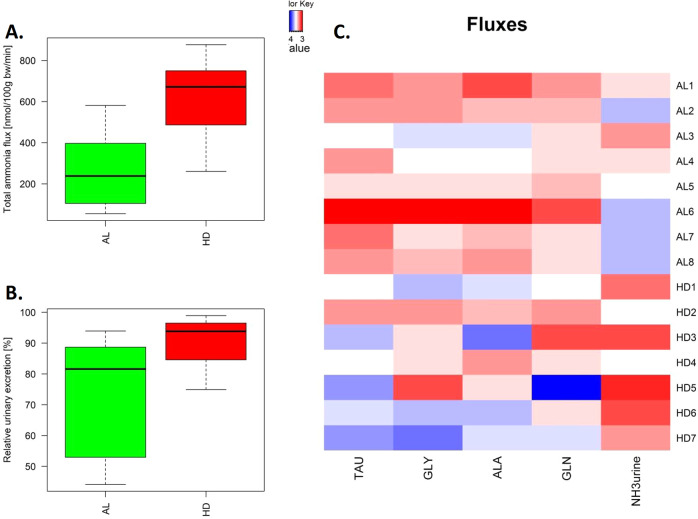
Fig. 2. Pre-hyperammonemic diet increased total renal ammoniagenesis.
A Total renal ammoniagenesis. B Percentage urinary excretion relative to total renal ammoniagenesis. C Scaled fluxes (P < 0.2), red indicates higher than the mean value, blue lower. This corresponds to clearance from the systemic circulation in kidney (blue) and addition to the systemic circulation (red) for the fluxes in the veins. In the boxplots, the center lines represent the median; box limits represent upper and lower quartiles; whiskers represent 1.5× interquartile range.

