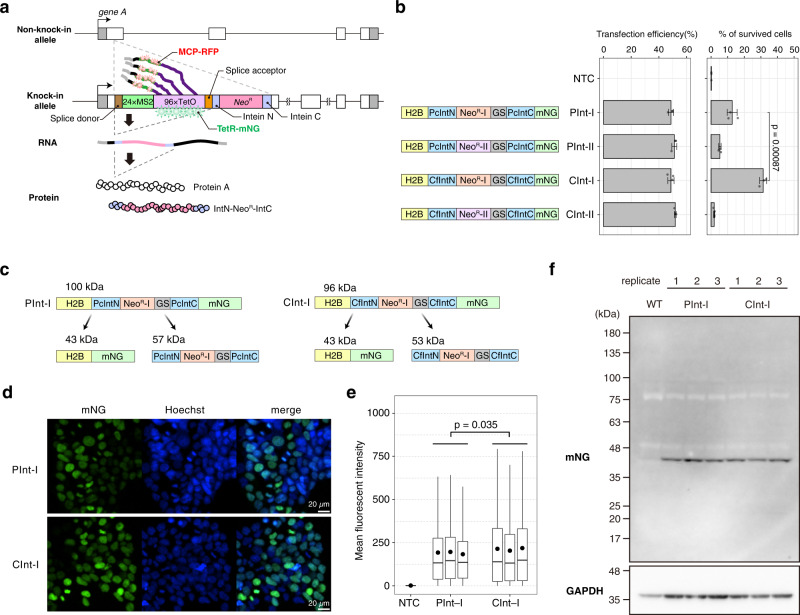
Fig. 1. Optimization of selection markers flanked by split inteins.
a Molecular structure and design of the STREAMING-tag. 24×MS2, 24× Sirius MS2 repeat; 96×TetO, 96× optimized TetO repeat. b Expression vectors containing split inteins with NeoR that encode G418 resistance protein were introduced into cells. The transfection efficiency and the percentage of cells that survived G418 selection were measured. Data are presented as the means of three biological replicates, and error bars indicate standard deviations. P-values correspond to unpaired, two-sided Student’s t-test. GS, GS linker; NTC, no transfection control. c Theoretical structure and size of PInt-I and CInt-I. d Fluorescent images of PInt-I and CInt-I cells established after G418 selection in b. mNeonGreen (mNG) and Hoechst stained nucleus images (both images are maximum intensity projections of confocal sections) are shown with their merges. Scale bar, 20 µm. e Boxplot represents distribution of mean fluorescent intensities of mNG channel in the cell nuclei of NTC, PInt-I and CInt-I are shown. Data for PInt-I and CInt-I include three biological replicates, and circles represent the means of each biological replicate (rep). NTC, n = 6,588, Pint-I rep1, n = 5,198, Pint-I rep2, n = 6,901, Pint-I rep3, n = 8,278, Cint-I rep1, n = 6,157, Cint-I rep2, n = 7,664, Cint-I rep3, n = 9,505. Box plots indicate the interquartile range IQR (25–75%) with a line at the median. Whiskers indicate 1.5 times the IQR. P-values correspond to unpaired, two-sided Student’s t-test. f Western blot analysis of PInt-I and CInt -I cells using mNG and GAPDH antibodies. Samples for PInt-I and CInt-I include n = 3 biological replicates.

