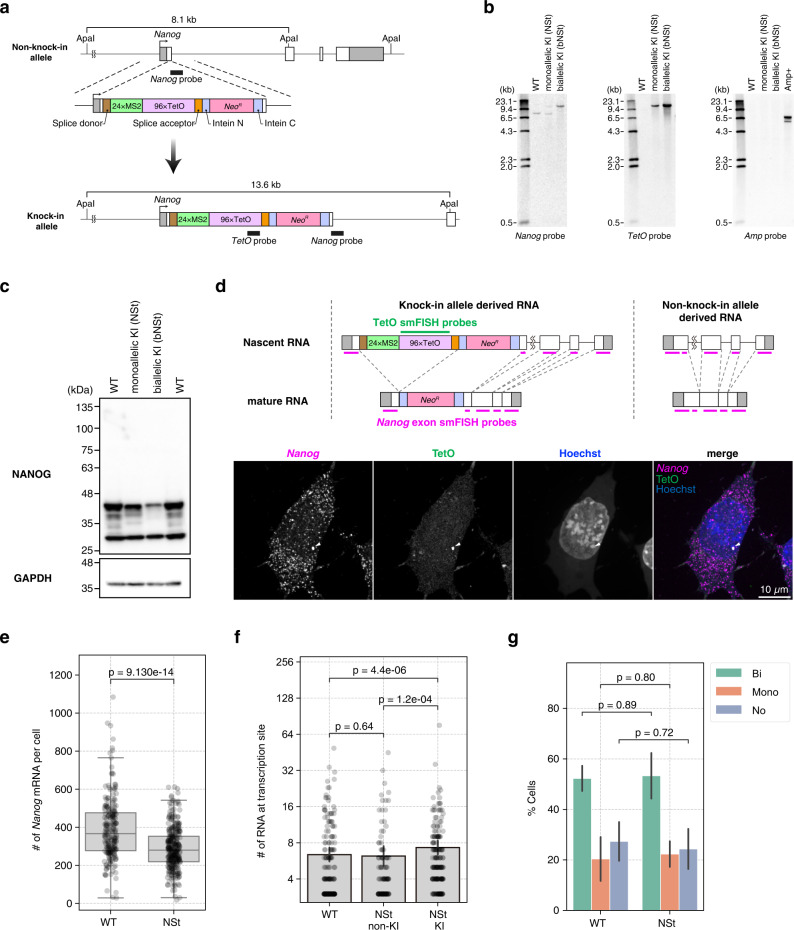
Fig. 2. STREAMING-tag knock-in into Nanog in mouse embryonic stem cells.
a Mouse Nanog gene structure after STREAMING-tag knock-in. b Southern blot analysis of mono- and bi-allelic Nanog-STREAMING knock-in (NSt and bNSt, respectively), and wild-type (WT) cells. c Western blot analysis of NSt, bNSt, and WT cells. d–g Single-molecule fluorescence in situ hybridization (smFISH) analysis of NSt and WT cells. d Upper panel shows the location of the smFISH probes, and the lower panels show example images of NSt cells. Arrowheads indicate Nanog transcriptional spots. Scale bar, 10 µm. e Distribution of Nanog mRNA counts in WT and NSt cells. WT, n = 214 cells; NSt, n = 311 cells. P-values were determined using two-sided Wilcoxon rank sum test. Box plots indicate the interquartile range IQR (25–75%) with a line at the median. Whiskers indicate 1.5 times the IQR. f Bar graph showing the number of RNA molecules at transcription sites in WT cells (WT), non-knock-in alleles of NSt cells (NSt non-KI), and knock-in alleles of NSt cells (NSt KI); WT, n = 203, NSt non-KI, n = 110, NSt KI, n = 181. P-values were determined using two-sided Wilcoxon rank sum test. g Bar graph showing the frequency of cells with transcription sites in WT and NSt mESCs. Cells were classified as having no transcription sites (No), only one (Mono), or two (Bi). Data are presented as the means of three biological replicates (more than 25 cells per experiment). The error bars indicate standard deviations. P-values correspond to unpaired, two-sided Student’s t-test.

