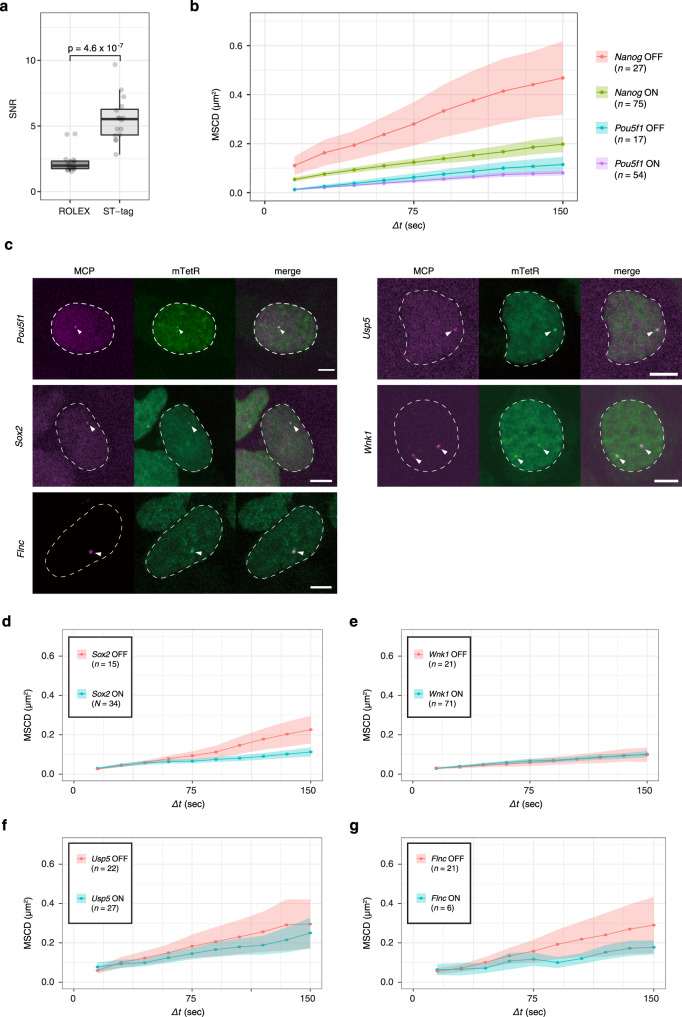
Fig. 4. Verification of versatility of the STREAMING-tag.
a Comparison of the signal-to-noise ratio (SNR) of DNA labeling spots between the ROLEX and STREAMING-tag systems. n = 16 cells. Box plots indicate the interquartile range IQR (25–75%) with a line at the median. Whiskers indicate 1.5 times the IQR. P-value was determined using two-sided Wilcoxon rank sum test. b Mean square change in distance (MSCD) of mTetR spots with respect to the center of the nucleus in NSt-NLS-SNAP cells for Nanog and PSt-NLS-SNAP cells for Pou5f1. The data are classified into the ON and OFF states. Means with standard error of the mean (SEM) are shown. n, number of cells analyzed. c Imaging of mTetR and MCP spots in knock-in cells with the STREAMING-tag into Pou5f1, Sox2, Flnc, Usp5, and Wnk1. Dashed lines and arrowheads indicate cell nuclei and mTetR/MCP spots, respectively. Scale bar, 5 µm. In Wnk1 STREAMING-tag knock-in cells, two spots were observed because the STREAMING-tag was knocked-in into both alleles. d–g MSCD of mTetR spots with respect to the center of the nucleus in SSt-NLS-SNAP for Sox2 (d), WSt-NLS-SNAP for Wnk1) (e), Ust-NLS-SNAP for Usp5 (f), and FSt-NLS-SNAP cells for Flnc (g). The data are classified into the ON and OFF states. Means with SEM are shown. n, number of cells analyzed.

