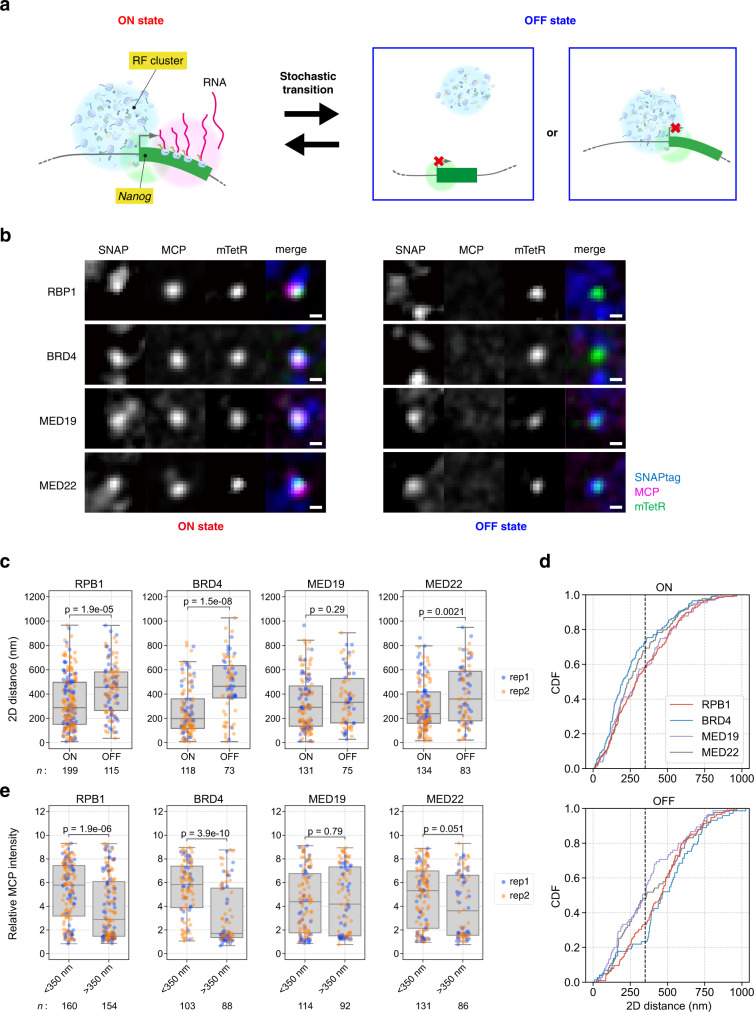
Fig. 6. RPB1 and BRD4 form clusters in proximity to Nanog only in the ON state in mESCs.
a Hypothetical spatial relationship between transcriptional regulatory factor (RF) clusters and Nanog. b Relationship between MCP, mTetR, and SNAP-tagged RFs. Using NSt-GR cells, which are derived from the Nanog STREAMING-tag knock-in cell line, and expressing mTetR-mNG and MCP-RFP, as a parental cell line, SNAPtag was knocked-in into RF genes. Images with (ON state; left) and without MCP (OFF state; right) are shown. Scale bar, 500 nm. c 2D distances between mTetR spots and the nearest SNAPtag clusters in the ON and OFF states. n, number of cells analyzed. Box plots indicate the interquartile range IQR (25–75%) with a line at the median. Whiskers indicate 1.5 times the IQR. The blue and orange spots indicate the results of independent experiments. P-values were determined using two-sided Wilcoxon rank sum test. d Cumulative density function (CDF) of the data in c. Black dashed line indicates 350 nm. e Distributions of MCP fluorescence intensities at the mTetR spot with the 2D distance between the mTetR spot and nearest SNAPtag cluster at <350 and >350 nm. n, number of cells analyzed. Box plots indicate the interquartile range IQR (25–75%) with a line at the median. Whiskers indicate 1.5 times the IQR. The blue and orange spots indicate the results of independent experiments. P-values were determined using two-sided Wilcoxon rank sum test.

