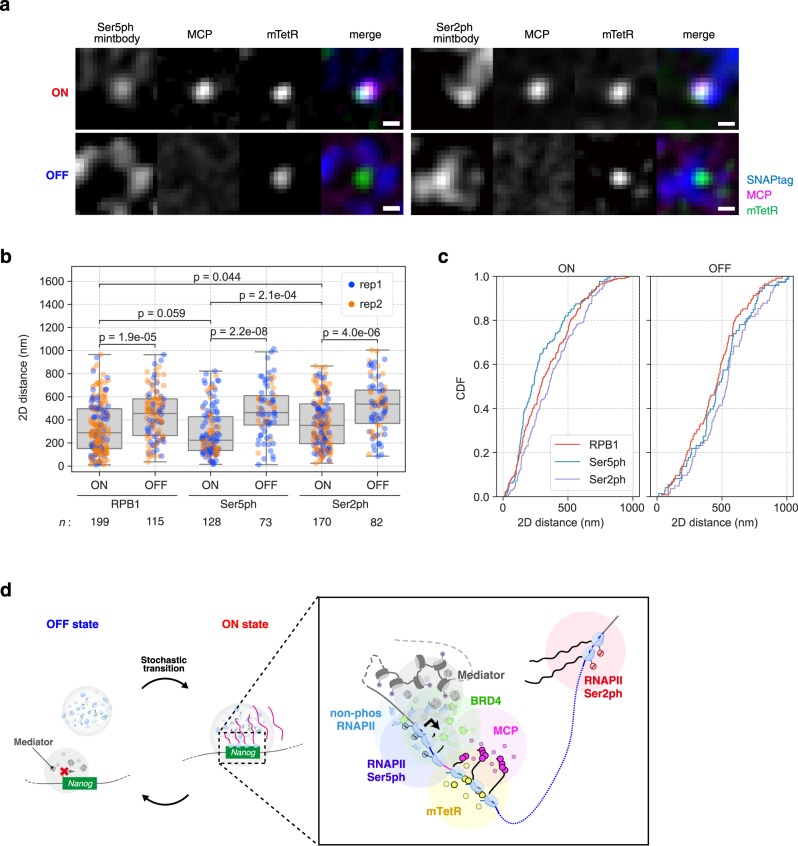
Fig. 7. RNAPII Ser5ph and Ser2ph form clusters in proximity to Nanog only in the ON state in mouse embryonic stem cells (mESCs).
a Images of RNAPII Ser5ph- and Ser2ph-mintbodies with MCP and mTetR. Cell lines expressing RNAPII Ser5ph and RNAPII Ser2ph mintbody-SNAPtag were established using NSt-GR as a parental cell line. Scale bar, 500 nm. b 2D distance between mTetR spots and the nearest SNAPtag foci in the ON and OFF states. Box plots indicate the interquartile range IQR (25–75%) with a line at the median. Whiskers indicate 1.5 times the IQR. The blue and orange spots indicate the results of independent experiments. RPB1 data are the same as in Fig. 6c, represented for ease of comparison. n, number of cells analyzed. P-values were determined using two-sided Wilcoxon rank sum test. c Cumulative density function (CDF) of the data in b. d Model of relationship among transcriptional activity, RF clusters, and different forms of phospho-RNAPII clusters in Nanog in mESCs.

