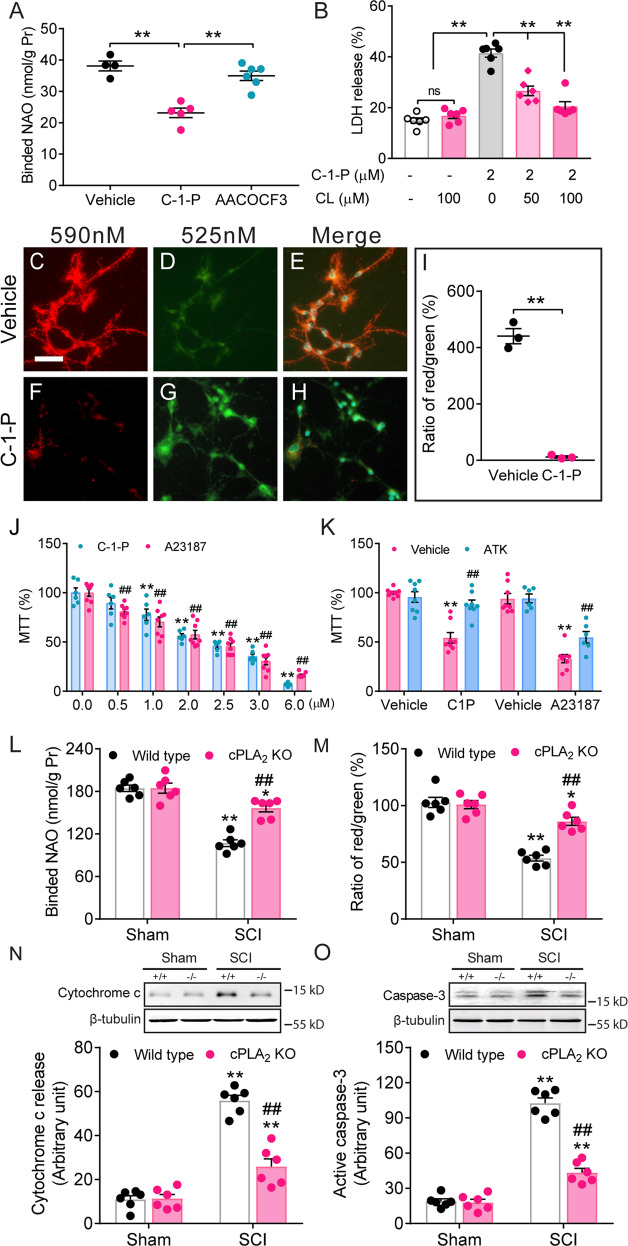
Fig. 5. Cytosolic phospholipase A2 (cPLA2) activation induces cardiolipin (CL) loss, leading to mitochondrial dysfunction and neuronal death.
A cPLA2 inhibitor AACOCF3 revised cPLA2 activation-induced CL loss. **P < 0.01 (One-way ANOVA, Tukey’s multiple comparisons test, n = 4–6). Data represent the mean ± s.e.m. from 3 independent culture experiments. B CL reduced cPLA2 activation-induced neuronal death. CL liposomes were added 30 min before C-1-P (2 µM) treatment. **P < 0.01; ns no significance. (One-way ANOVA, Tukey’s multiple comparisons test, n = 6). Data represent the mean ± s.e.m. from 3 independent culture experiments. C–H C-1-P induced mitochondrial membrane potential (MMP, Δψm) change measured with the cationic dye JC-1 in cultured spinal neurons. Vehicle-treated neurons showed strong J-aggregation (red). After C-1-P treatment, the majority of neurons showed green staining due to low Δψm. Bar, 50 µm. I Bar graph shows C-1-P induced a significant decrease in the ratio of red/green, indicating that activation of cPLA2 induced mitochondrial dysfunction (**P < 0.01, Student t test, n = 3). J Cultured spinal cord neurons were treated with the designated concentrations of C-1-P or A23187 for 24 h. MTT assay revealed that both cPLA2 activators, C-1-P and A23187, induced mitochondrial dysfunction and neuronal death in a dose-dependent manner. **P < 0.01, ##P < 0.01 versus the vehicle control (One-way ANOVA, Tukey’s multiple comparisons test, n = 6–8). Data represent the mean ± s.e.m. from 3 independent experiments. K Importantly, mitochondrial dysfunction and neuronal death induced by C-1-P (2 µM) or A23187 (5 µM) were significantly reversed by AACOCF3 (15 µM), a cPLA2 inhibitor. AACOCF3 was added 30 min before C-1-P or A23187 administration, and the culture cells were examined for MTT at 24 h after the activator treatment. **P < 0.01 versus the vehicle control, ##P < 0.01 versus the C-1-P or A23187 group (Two-way ANOVA, Tukey’s multiple comparisons test, n = 7–8. Data represent the mean ± s.e.m. from 3 independent experiments. L–O cPLA2 ablation protected against CL loss (L), mitochondrial dysfunction (M), and apoptosis (N–O) induced by SCI. L NAO-labeled cardiolipin expression at 1 day after SCI. M A ratio of red/green, indicating mitochondrial function. N Cytochrome c release at 1 day after SCI. O Expression of active caspase-3 at 1 day after SCI. Data represent mean ± s.e.m. *P < 0.05, **P < 0.01 vs sham; ##P < 0.01 vs WT (Two-way ANOVA, Tukey’s multiple comparisons test, n = 6 mice/group).

