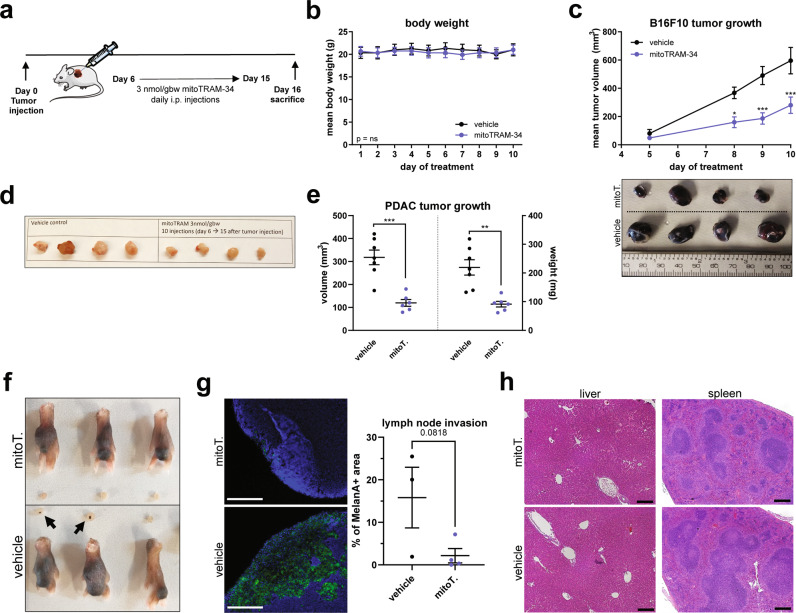
Fig. 5. The novel TRAM-34 derivatives reduce tumor growth in vivo in a melanoma and pancreatic cancer model.
a Treatment scheme for mice. 6 days after tumor injection, mice were treated daily intraperitoneally (i.p.) with 3 nmol/gram body weight (gbw) mitoTRAM-34 for 10 days and sacrificed the day after the last treatment. b Body weight of vehicle- vs mitoTRAM-34-treated mice during treatment (mean + SEM, N = 4–6. Two-Way Anova. ns = not significant). c Tumor volume of B16F10 cells injected subcutaneously, measured at different time points during the treatment with a digital caliper. The volume was calculated using the formula (a*b2)/2. N = 4 (control) and 6 (mitoTRAM-34). Tumors isolated at the end of the treatment are shown below. Mean + SEM are reported (Two-Way Anova with Bonferroni’s multiple comparison test. *p < 0.05, ***p < 0.001). d Representative images of vehicle- or mitoTRAM-34 treated pancreatic tumors (orthotopic injection of PAN-02 cells). e Scatter plots showing mean + SEM of pancreatic tumor volume (calculated (a*b2)/2) and weight. a and b correspond to the length (a) and width (b) of the tumor. N = 6 (mitoTRAM-34) and 7 (control) (Unpaired T-test. **p < 0.01, ***p < 0.001). f For lymph node infiltration, B16F10 cells were injected in the footpad of mice, which were treated as in (a). Feet and popliteal lymph nodes of treated vs control mice are shown. No black dots (melanoma cells) are visible in the lymph nodes of mitoTRAM-34-treated mice, while present in the vehicle control (black arrows). N = 3 (control) and 4 (mitoTRAM-34). g Representative images of lymph nodes shown in (f) stained with Melan-A (green, specific for melanoma cells) and Hoechst (nuclei) isolated from mitoTRAM-34 (mitoT.)-treated or control mice. Quantification of the Melan-A-positive area on the total area of the lymph node is shown on the right (mean + SEM, unpaired T-test. N = 3–4. p-value is indicated). Scale bar is 200 µm. h Representative images of H&E stainings of liver and spleen sections of vehicle- and mitoTRAM-34-treated mice as indicated. The treatment regimen is shown in (a). Scale bar is 250 µM.

