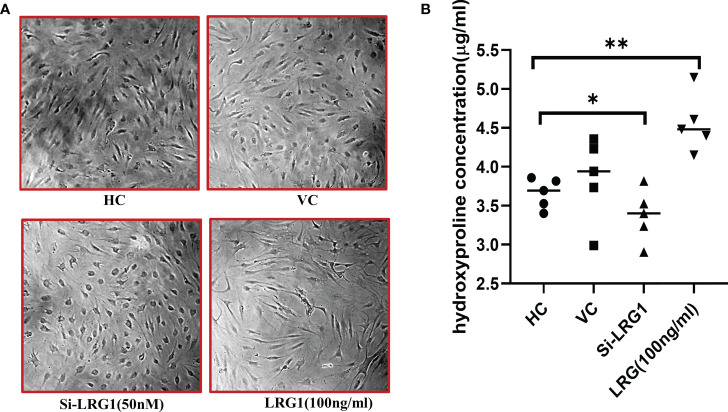
Figure 5.
Hydroxyproline assay after stimulation/knockdown of LRG1. Microscopy images were taken at ×10 magnification using Nikon Eclipse 650 (NIKON, Tokyo, Japan). The optical density of hydroxyproline was measured with a spectrophotometer (Molecular Devices, San Jose, CA, USA). Graphs were generated and the statistical analysis carried out using GraphPad Prism (version 8.4.686). Data are presented as the mean ± standard deviation (SD). One-way ANOVA was used to compare the data among groups to show statistical significance. (A) Increased extracellular matrix observed in primary synovial cells from patients with OA after stimulation using pure LRG1 (100 ng/ml); a reverse effect was observed morphologically after silencing the LRG1 gene using 50 nM siRNA compared to the non-treated group. (B) Level of collagen measured with the hydroxyproline assay. The level of hydroxyproline indicated a 1.3-fold increase in the stimulated (with 100 ng/ml LRG1) group compared to the control group, with 0.74 and 0.9-fold decreased levels of hydroxyproline in the knockdown (50 nm si-LRG1) group compared to the LRG1-treated and the non-treated group, respectively. *p ≤ 0.05; **p ≤ 0.01. LRG1, leucine-rich alpha-2 glycoprotein; OA, osteoarthritis.

