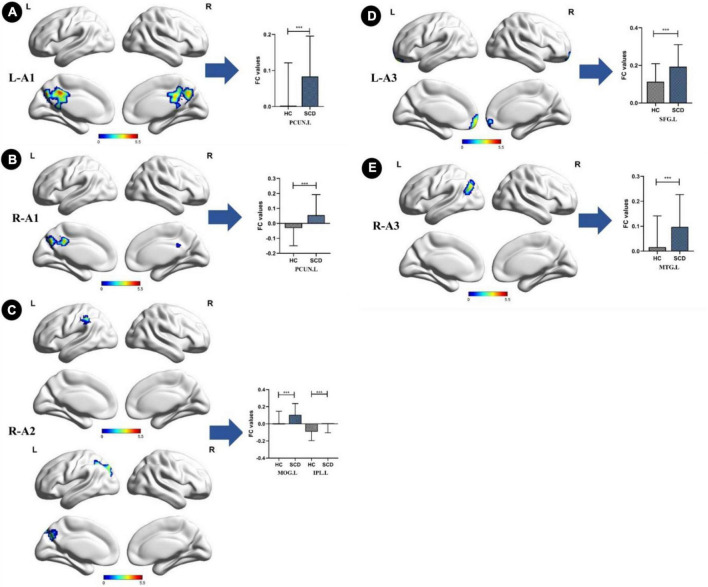
FIGURE 2.
Anterior cingulate cortex subregions functional connectivity in patients with subjective cognitive decline (SCD) compared to healthy control (HC). (A) Functional connectivity (FC) of left caudal anterior cingulate cortex subregion (L-A1) between HC and SCD patients. A bar chart indicating the quantitative comparison of FC between these regions. (B) FC of right caudal anterior cingulate cortex subregion (R-A1) between HC and SCD patients. A bar chart indicating the quantitative comparison of FC between these regions. (C) FC of right dorsal anterior cingulate cortex subregion (R-A2) between HC and SCD patients. A bar chart indicating the quantitative comparison of FC between these regions. (D) FC of left subgenual anterior cingulate cortex subregion (L-A3) between HC and SCD patients. A bar chart indicating the quantitative comparison of FC between these regions. (E) FC of right subgenual anterior cingulate cortex subregion (R-A3) between HC and SCD patients. A bar chart indicating the quantitative comparison of FC between these regions. only the subnetworks that show between-group differences are shown here. All results are displayed after adjusting for age, sex, and education. A threshold of p < 0.05 was applied, with a TFCE-FWE correction with cluster size > 200 mm3. FC, functional connectivity; HC, healthy controls; SCD, subjective cognitive decline; PCUN.L, left precuneus; MOG.L, left middle occipital gyrus; IPL.L, left inferior parietal lobule; SFG.L, left superior frontal gyrus; MTG.L, left middle temporal gyrus. ***p < 0.05.

