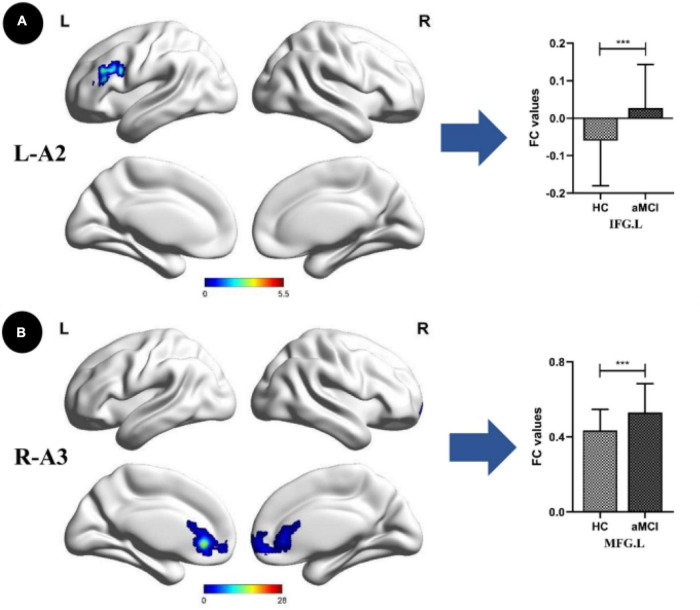
FIGURE 3.
Anterior cingulate cortex subregions functional connectivity in patients with amnestic mild cognitive impairment (aMCI) compared to healthy control (HC). (A) Functional connectivity (FC) of left dorsal anterior cingulate cortex subregion (L-A2) between HC and aMCI patients. A bar chart indicating the quantitative comparison of FC between these regions. (B) FC of right subgenual anterior cingulate cortex subregion (R-A3) between HC and aMCI patients. A bar chart indicating the quantitative comparison of FC between these regions. Only the subnetworks that show between-group differences are shown here. All results are displayed alter adjusting for age, sex and education. A threshold of p < 0.05 was applied, with a TFCE-FWE correction with cluster size > 200 mm3. FC, functional connectivity; HC, healthy controls; aMCI, amnestic mild cognitive impairment; IFG.L, left inferior frontal gyrus; MFG.L, left middle frontal gyrus. ***p < 0.05.

