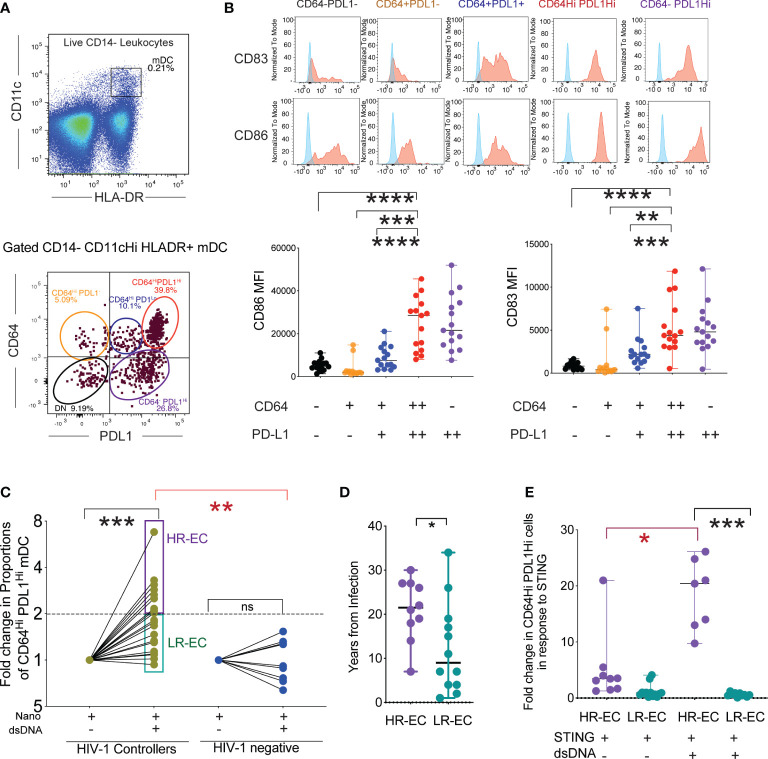
Figure 1.
Identification of a subgroup of EC with high mDC response to intracellular HIV -1 dsDNA stimulation. (A) (upper diagram) Representative Flow cytometry gating strategy defining mDC as CD14- HLADR+ CD11cHi cells within PBMC stimulated with HIV-1 Gag dsDNA. (lower diagram): Identification of different subpopulations of mDC, based on surface expression levels of CD64 and PD-L1 following stimulation with nanoparticles loaded with HIV-1 Gag dsDNA. (B) (upper panel): Representative flow cytometry histograms reflecting expression of activation markers CD86 and CD83 in subsets of mDC defined by expression signatures of CD64 and PD-L1. Background FMO controls (shown in blue) for each population are overlayed on each histogram. (lower panel) Mean Fluorescence Intensity (MFI) of CD86 and CD83 in indicated mDC subsets after stimulation with nanoparticles loaded with HIV-1 Gag dsDNA. Data from n=15 EC participants are shown. (**p<0.01, ***p<0.001, ****p<0.0001, two-tailed Wilcoxon test). (C) Fold change in proportions of CD64Hi PD-L1Hi mDC from EC and HIV-1 negative donors in response to stimulation with nanoparticles loaded with HIV-1 Gag dsDNA compared to nanoparticles alone (Nano). High responder (HR-EC; purple) and low responder (LR-EC; light green) EC subpopulations are defined. Data are represented in a Log2 scale. Statistical significance of differences among EC or compared to HIV-1 negative donors were calculated using two-tailed matched-pairs Wilcoxon test (black; *** p<0.001) or Mann Whitney tests (red; **p<0.01), respectively. (D) Years since infection in HR-EC and LR-EC subgroups. (*p<0.05, Mann Whitney test). (E) Fold change in proportions of CD64Hi PD-L1Hi mDC from HR-EC (violet) and LR-EC (green) after stimulation with soluble 2´3´-c-di-AM(PS) (STING agonist) alone or in combination with HIV-1 Gag dsDNA. Statistical significance of differences within and among EC subgroups were calculated using two-tailed matched pairs Wilcoxon tests (black) or Mann Whitney U tests (red), respectively, *p<0.05; ***p<0.001.

