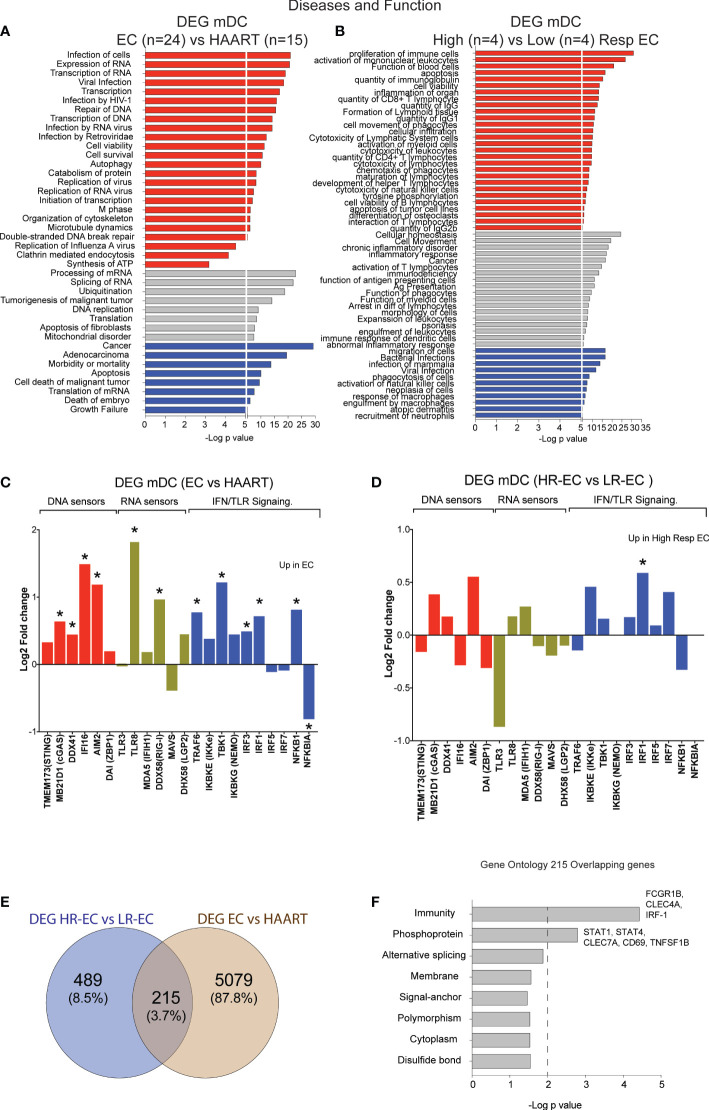
Figure 2.
Identification of transcriptional signatures of mDC from total EC and from High vs Low EC responders. (A, B) Ingenuity Pathway Analysis (IPA) for selected diseases and functions for DEG between mDC from total EC (n=24) vs ART-treated individuals (n=15) (A) and High-Responder (HR, n=4) vs Low-Responder (LR, n=4) EC subgroups (B). Pathways predicted to be upregulated (red), downregulated (blue) or with non-directional predictions (grey) are highlighted. (C, D) Log2 Fold change in expression of selected DNA sensors, RNA sensors and IFN pathway elements included in the list of DEG for EC vs HAART-treated individuals (C) and for HR vs LR EC (D). Statistically significant (FDR-adjusted p<0.05 EC vs HAART; nominal p<0.05 HR-EC vs LR-EC) DEGs are highlighted with a star. (E) Venn diagram representing overlap between DEG from total EC vs HAART participants and DEG from HR-EC vs LR-EC subgroups. (F) Biological pathways enriched within the 215 overlapping genes defined in (E), as determined by DAVID gene ontology analysis. *p < 0.05.

