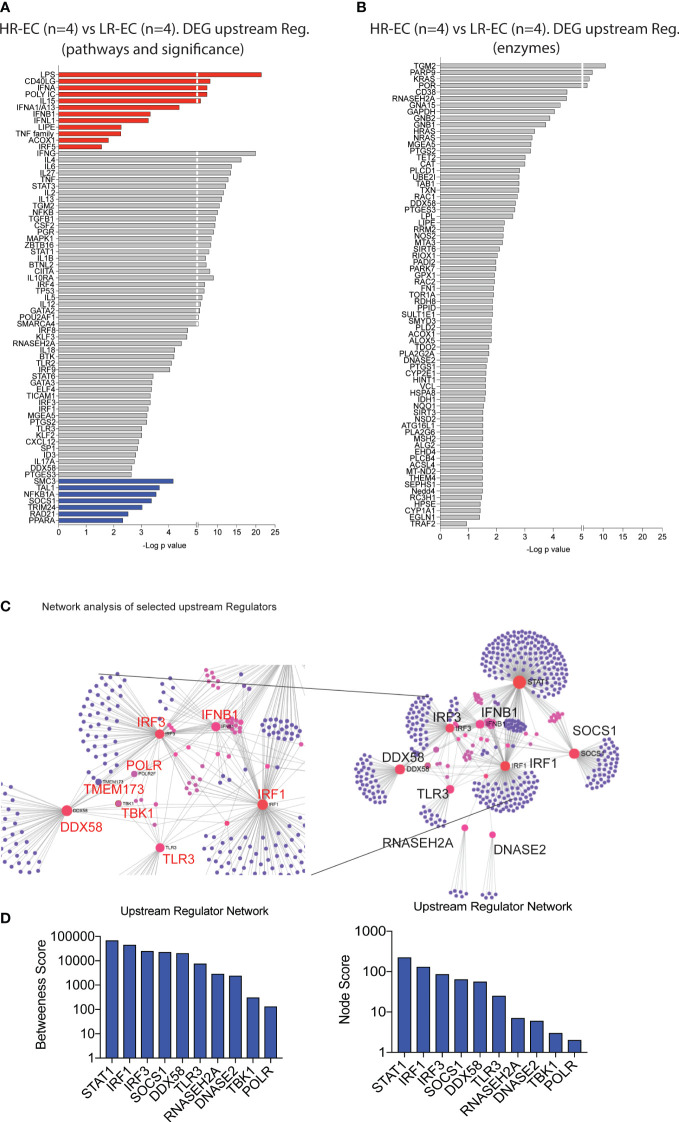
Figure 3.
Identification of potential upstream regulators for the high responder EC. (A, B) Selected upstream regulators of DEG distinguishing high responder (HR-EC) vs low responder (LR-EC) EC subgroups, as determined by Ingenuity Pathway Analysis. Data reflect all immune pathways (left) or only molecules with enzymatic activity (right). Molecules with a predicted positive upstream effect are highlighted in red, while molecules with a predicted negative effect are in blue. (C) Network interaction of selected upstream regulators identified in (A) (right panel) highlighting relevant genes within interaction nodes (red) and connecting genes (pink) as well as individual gene targets (violet). Zooms on the central Gene Nodes are displayed in the left panel. (D) Analysis of Betweenness and Node scores of upstream regulator genes included within network defined in (C).

