Figure 3.
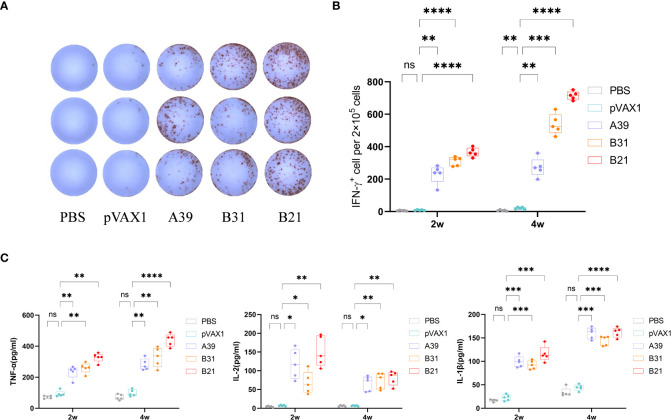
Measurement of cytokine production. Two weeks after immunization, mouse splenocytes were stimulated in vitro with fusion proteins A39, B31, B21 (5 µg/mL), P/I or PBS for 16 h. Antigen-specific IFN-γ secreting cells were measured by ELISPOT; cytokines in the supernatant were detected using ELISA. (A) Display of IFN-γ specific spot forming cells. Three representative samples from each group were selected for the showcase. (B) IFN-γ responses between groups were compared. (C) Specific release of TNF-α, IL-2, and IL-1β between groups. Data are shown as mean±SD, n = 5. Statistical analyses performed by one-way ANOVA (ns, No significance; *P < 0.05; **P < 0.01; ***P < 0.001; ****P < 0.0001).

