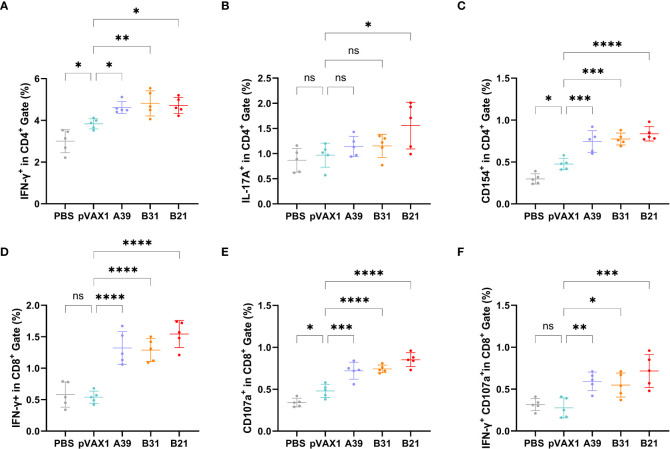
Figure 4.
Frequency of T cell subsets in splenocytes assessed by flow cytometry. Two weeks after immunization, spleen lymphocytes isolated from vaccine and control mice were stimulated in vitro with the fusion protein for 16 h. Representative dot plots are shown for (A) % IFN-γ+ cells in CD4+ T cell subset, (B) % IL-17A+cells in CD4+ T cell subset, (C) % CD154+cells in CD4+ T cell subset, (D) % IFN-γ+ cells in CD8+ T cell subset, (E) % CD107a+ cells in CD8+ T cell subset, and (F) % IFN-γ+CD107a+cells in CD8+ T cell subset. Data are shown as mean±SD, n = 5. Statistical analyses were performed by one-way ANOVA (ns, No significance; *P < 0.05; **P < 0.01; ***P < 0.001; ****P < 0.0001).

