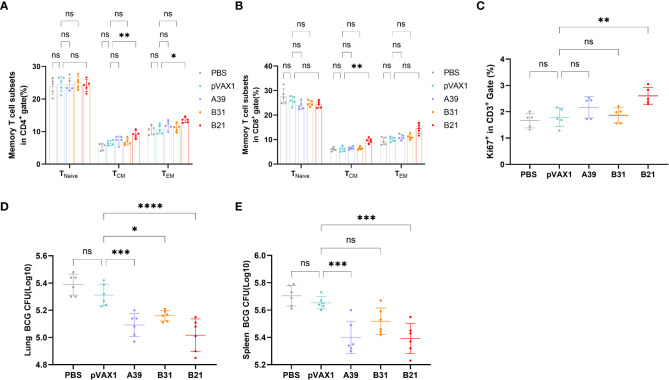
Figure 5.
Specific memory T cells in Spleens detected by flow cytometry. (A) Proportion of TEM(CD44+CD62L-) and TCM (CD44+CD62L+) in CD4+ T cells. (B) Proportion of TEM(CD44+CD62L-) and TCM (CD44+CD62L+) in CD8+ T cells. Statistical analyses were performed by the method of two-way ANOVA. (C) Proportion of Ki-67+ cells (one-way ANOVA). (D, E) Bacterial counts in the spleens and lungs of mice (one-way ANOVA). Data are shown as the mean±SD, n =5 /6. (ns, No significance; *P < 0.05; **P < 0.01; ***P < 0.001; ****P < 0.0001).

