Figure 6.
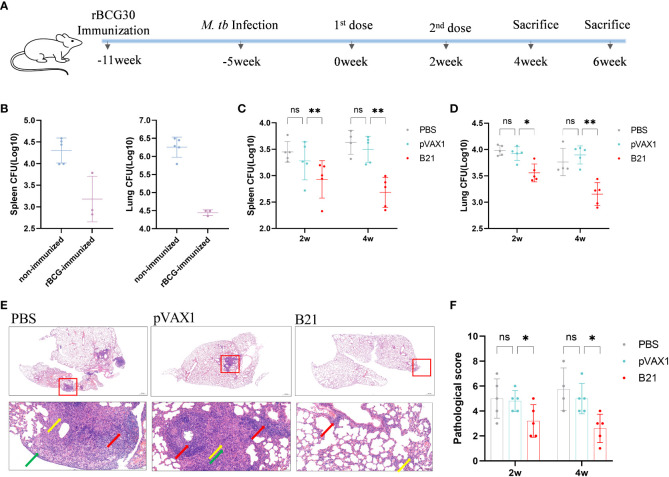
Detection of bacterial counts in the spleens and lungs tissues of mice after treatment. 2 and 4 weeks after the last treatment in the LTBI model, mice were sacrificed for tissue load counts. (A) Schedules of the preparation and treatment of mouse LTBI model. (B) non-immunized and rBCG-immunized mice were sacrificed 5 weeks after M. tb challenge, and lungs and spleens bacterial counts were measured. n=3/5. (C, D) Bacterial counts in the spleens and lungs of mice (two-way ANOVA). n = 4/5. Data are shown as mean±SD (ns, No significance; *P < 0.05; **P < 0.01). Lungs were collected 2 and 4 weeks after treatment, preserved in 4% paraformaldehyde, and processed for sectioning and staining with H&E. (E) Representative lung pathological changes from the different groups. Arrows mark lymphocytes (red arrows), macrophages (green arrows), and neutrophils (yellow arrows). Original magnification, 2x and 20x. (F) Pathological scoring of the lungs.

