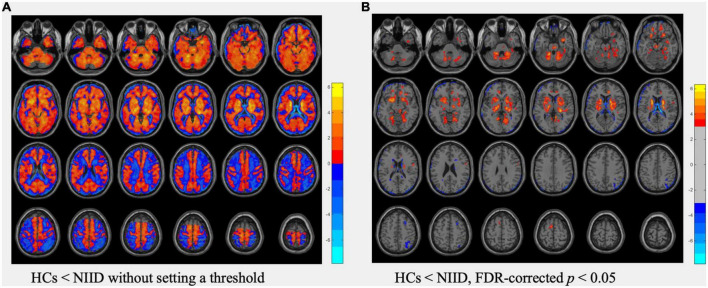
FIGURE 1.
Comparisons of cerebral blood flow (CBF) data between healthy controls (HCs) and neuronal intranuclear inclusion disease (NIID) patients using t-test. (A) The T map of CBF differences without setting a threshold. (B) The T map thresholded using FDR-corrected p <0.05, showed regions with significant CBF differences between HCs and NIID. Color bars denote the t values.

