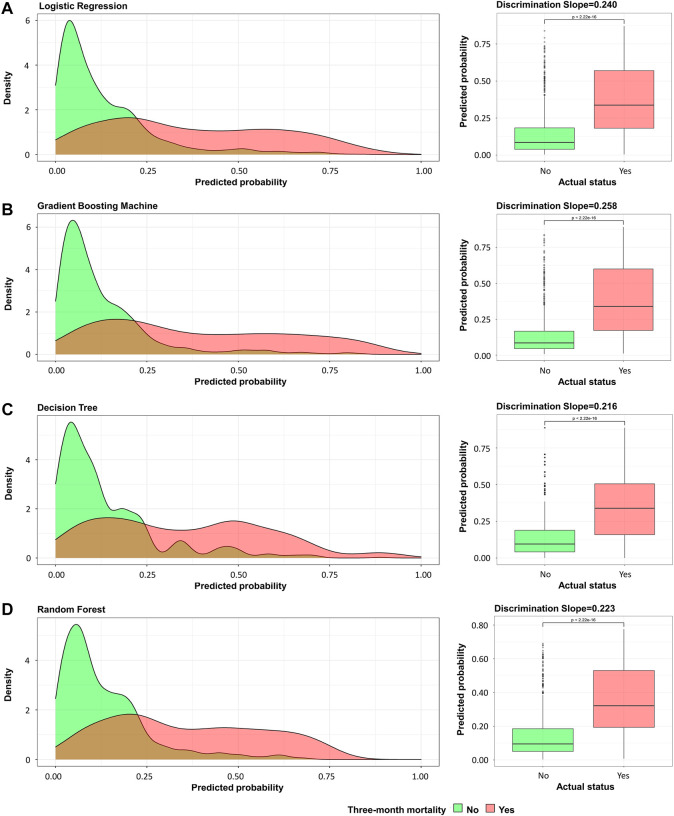
FIGURE 3.
Probability curve and discrimination slope. (A) Logistic regression; (B) gradient boosting tree; (C) decision tree; (D) random forest. Green curve indicates patients without early death and red curve indicates patients with early death. Probability curve was plotted with predicted probability of early death against density. On calculating discrimination slope, actual status was plotted against predicted probability.

