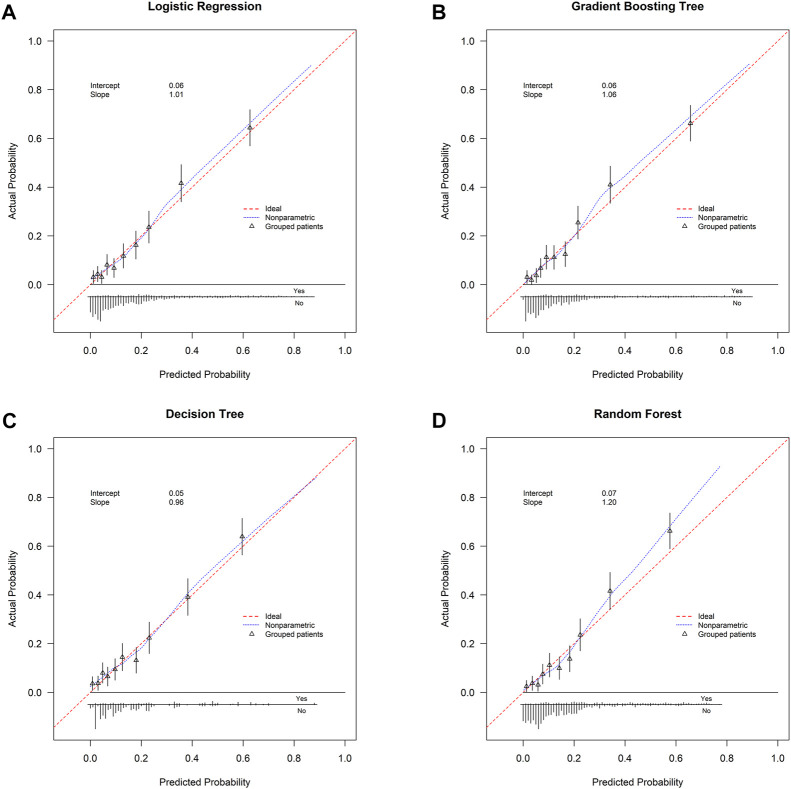
FIGURE 4.
Calibration curve. (A) Logistic regression; (B) gradient boosting tree; (C) decision tree; (D) random forest. Calibration curve is plotted with predicted probability against actual probability. Red dotted line indicates ideal consistency between predicted and actual probability of early death. Intercept-in-large value and calibration slope are both shown in the curves.

