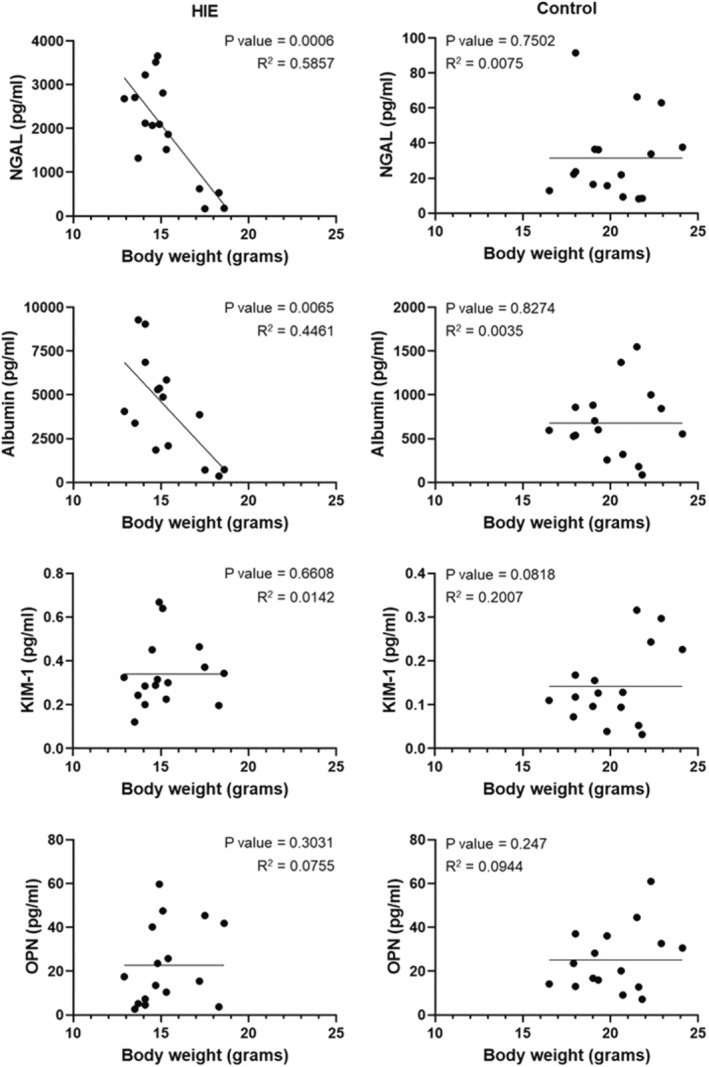
FIGURE 5.

Correlation between urinary biomarkers of AKI and body weight within individual pups receiving either HIE injury or no intervention control, at 1, 2, and 3, days from start of experiment. Data points represent a single time point for an individual animal. Lines represent linear fits of data sets associated with p and R2 values. n = 4–6 pups/treatment group/time point.
