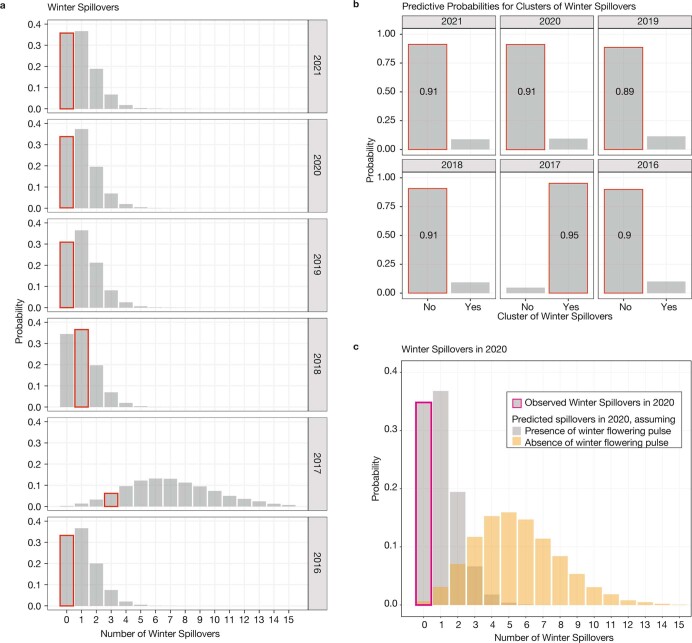
Extended Data Fig. 10. Predicted probabilities for total number and clusters of winter spillovers.
(a) Predicted probability for total number of winter spillovers (grey bars) and observed number of winter spillovers (red outlines). (b) Predicted probability for a cluster of spillovers (grey bars, defined as three or more spillovers) and the observed presence or absence of a cluster of winter spillovers (red outlines). In both figures, predictions are made using all observed data up to that time, but information from future years is not incorporated into predictions. The period of 2016 through 2021 was chosen for probabilistic predictions because enough preceding data allowed predictions. Food shortages were seen preceding years 2017 and 2020, but only the year 2017 included both a food shortage and a lack of a winter flowering pulse. All the predictions are supported by the realized data, which fall in higher mass parts of the distributions in (a) and align with predictions with high predicted probabilities in (b). (c) Predictive distribution of the total number of spillovers in winter 2020, following a food shortage in 2019. The grey bars indicate the spectrum of probabilistic predictions for spillover, given a winter flowering pulse. A winter flowering pulse did occur in early July 2020 and no winter spillovers were observed (pink outlined bar). Had no flowering pulse occurred, we predicted many more spillover events (yellow bars).

