
Fig. 3. The distribution of Pteropus alecto roosts during winter.
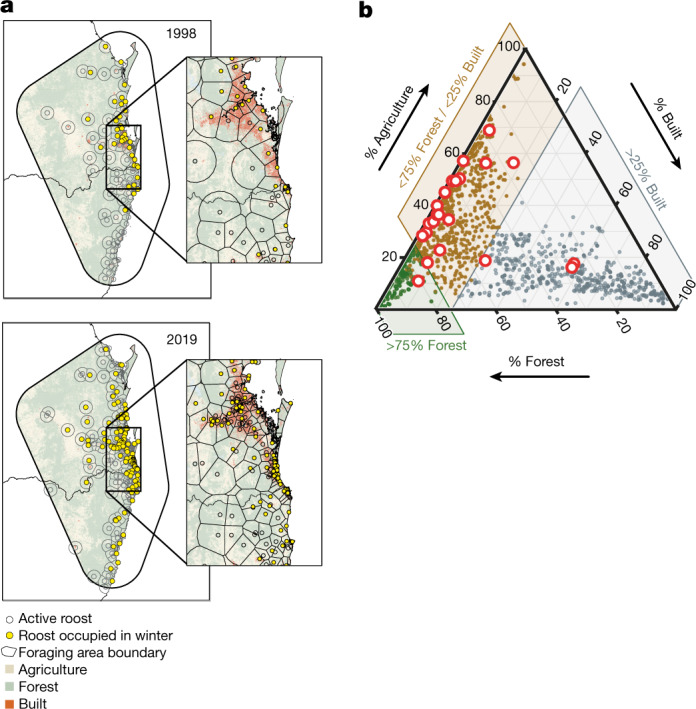
a, Expansion of the number and distribution of roosts occupied by Pteropus alecto during winter from 1998 to 2019. The base-map was obtained from the Australian Bureau of Statistics digital boundary files (www.abs.gov.au). b, Proportion of the foraging area surrounding roosts that was classified as built, forested or agricultural (Supplementary Information 13). The red circles indicate roosts that were the sources of winter spillovers.