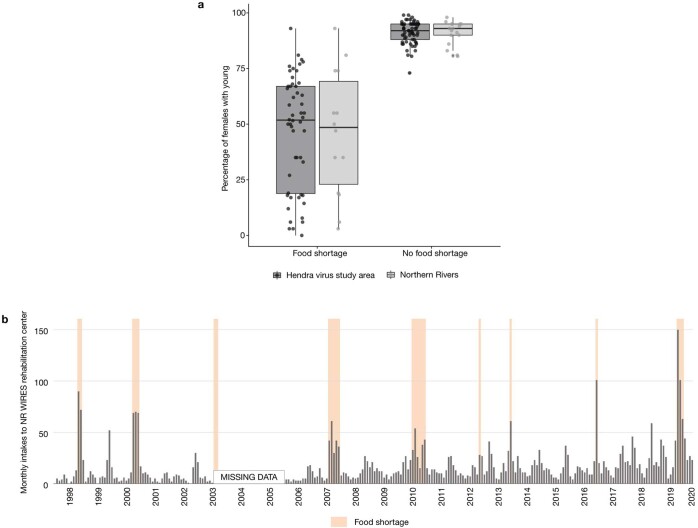
Extended Data Fig. 2. Measures of flying fox fitness identified as important proxies of food shortage in regression tree model.
(a) index of reproductive output: annual estimates of the percentage of adult females occupying roosts in the Northern Rivers (NR) region (light grey) and throughout the Hendra virus study area (black) carrying live young pre-weaning; data are grouped according to whether a period of nectar shortage was recorded by apiarists during the winter or spring associated with that birth cohort (n = 9 years) versus cohorts when a nectar shortage was not recorded (n = 14 years). Data acquired in years of food shortage were widely dispersed relative to highly clustered data acquired in years without food shortage. Patterns of data distribution were consistent between the NR region and the full study area. Box plots show median values, upper and lower quartiles and all data points. (b) monthly counts of admissions to Northern Rivers WIRES wildlife rehabilitation center with months classified as nectar shortage by apiary data (indicated by orange bars). No intake records were available from June 2003 through December 2005. The bounds of the box correspond to the 25th and 75th percentiles, the middle dash is the median, and the whiskers extend to the largest value no further than 1.5 times the interquartile range from the 25th or 75th percentile.

