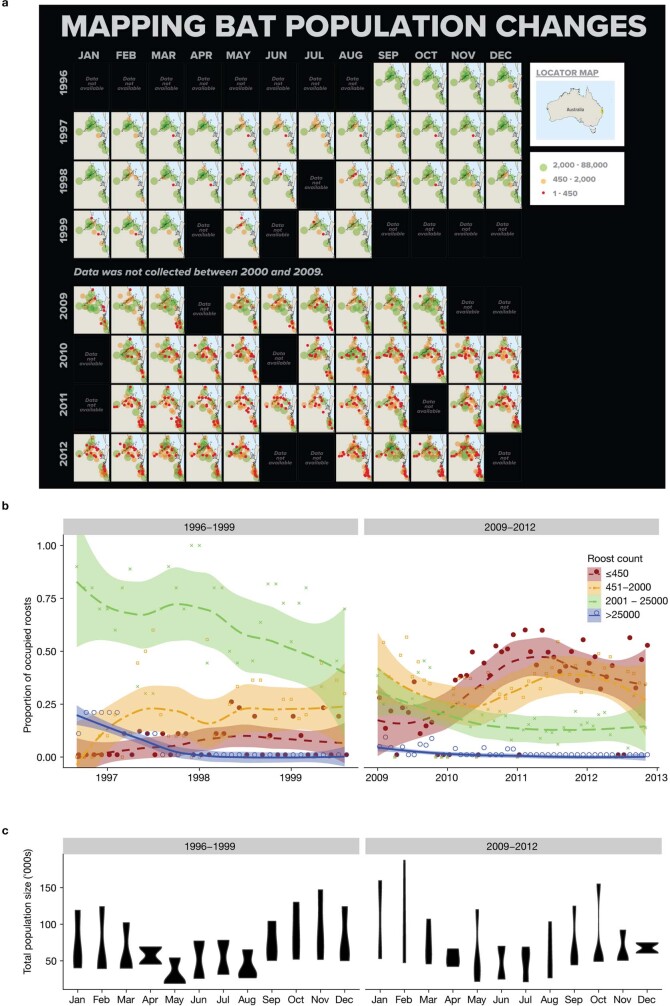
Extended Data Fig. 4. Changes through time in the number and estimated population size of roosts occupied by black flying foxes Pteropus alecto in the SEQ study area.
Censuses of roosts were conducted monthly in two time periods: T1 = 1996–1999 and T2 = 2009–2012. (a) Monthly maps of roost locations and population size grouped in three quantiles. The base-map was obtained from the Australian Bureau of Statistics Digital boundary files (www.abs.gov.au). (b) An additional population size category (>25,000) was added to illustrate change in large roosts. The line is a LOESS best fit and gray shading indicates 95% confidence intervals. (c). Total population estimates of black flying foxes (all roosts combined) grouped by month and year and summarized in violin plots. The number and locations of roosts was stable in T1 (n = 12) and increased from 34 to 80 in T2, although total estimates of black flying foxes in the study area remained stable.

