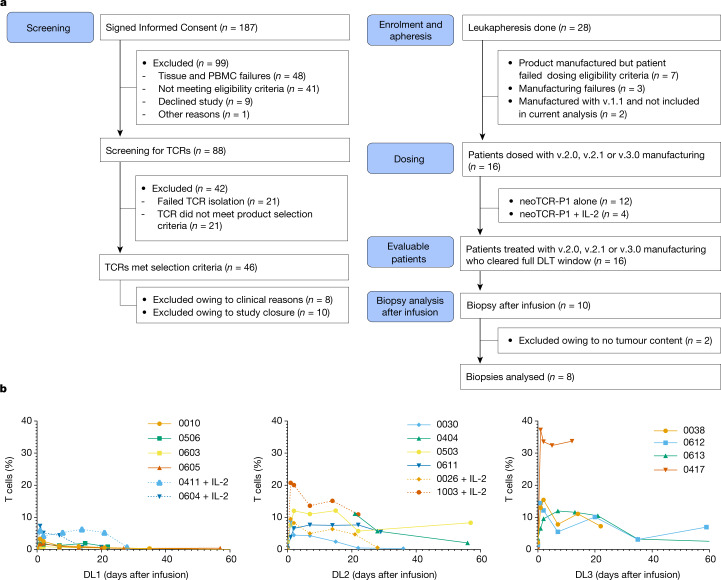
Fig. 3. Clinical trial patients and samples, and analysis of neoTCR transgenic T cells in blood after infusion.
a, Consolidated standards of reporting trials diagram, with the number of patients who provided consent, continued onto TCR isolation and leukapheresis, had clinical products manufactured for them, were infused with neoTCR transgenic T cells and provided blood and biopsy samples for analyses. DLT, dose-limiting toxicity. b, Expansion and persistence of neoTCR transgenic T cells in peripheral blood of patients, as measured by flow cytometry of stained peptide–HLA multimer cells. Percentages of total T cells from patients in the dose level 1 (DL1), DL2 and DL3 groups are shown. Patients who also received IL-2 therapy are indicated by dotted lines. All available time points were analysed. For patient 0613, 1.3% neoTCR+ cells was measured at day 106 after infusion. The limit of detection is approximately 0.16%.

