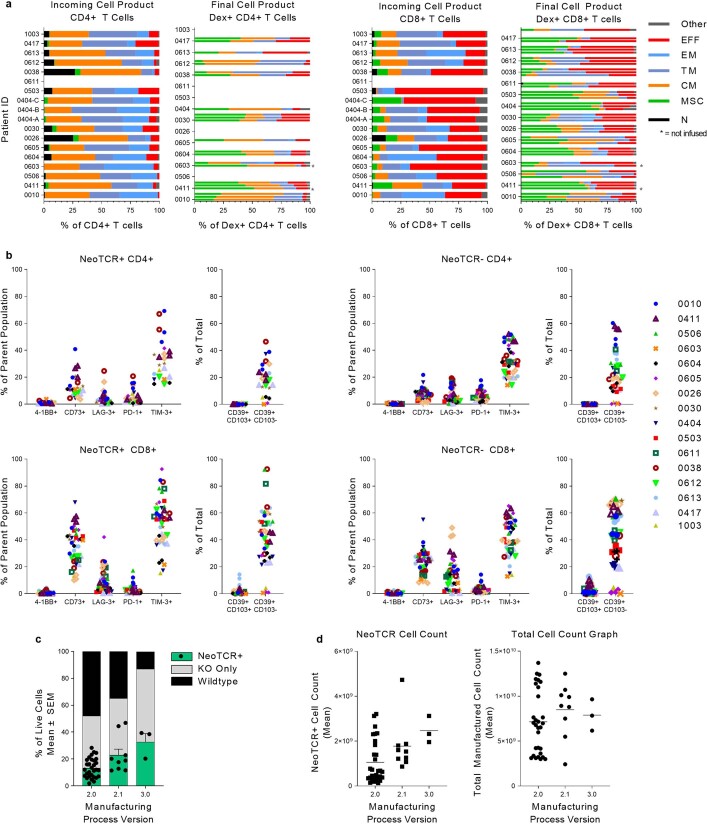
Extended Data Fig. 3. Characteristics of the manufactured product.
a) Phenotype of CD4+ T cells (left) and CD8+ T cells (right) in incoming leukapheresis and final cell product from dosed patients. Bars represent individual NeoTCR-T cell products for each patient (up-to-3 neoTCRs per patient). For Dex+ CD4+ T cells, only products where the peptide-HLA multimer binds the inserted TCR in the absence of the CD8 co-receptor have data. T cell subset abbreviations are as follows: EFF (effector), EM (effector memory), TM (transitional memory), CM (central memory), MSC (memory stem cell), N (naïve). b) T cell activation and phenotypic markers in the manufactured FCP. Percentage of CD4+ (top) or CD8+ (bottom) NeoTCR+ (left) or NeoTCR- (right) cells in the manufactured product that express the indicated surface markers. For NeoTCR+ CD4+ T cells, only products where the dextramer binds the inserted TCR in the absence of the CD8 co-receptor have data. c) NeoTCR knock-in efficiency of the endogenous TCR improved with changes in the manufacturing process. NeoTCR+ percentages were significantly different with the different process versions (***p = 0.0006 by ANOVA; v2.1 and v3.0 were significantly better than process v2.0: *p = 0.0218 and **p = 0.0029, respectively, by Tukey’s multiple comparisons test, v2.0: n = 30, v2.1: n = 9, v3.0, n = 3). d) Cell counts of neoTCR+ cells (left) and total cells (right) in manufacturing process v2.0 (n = 30) compared to process v2.1 (n = 9) and v3.0 (n = 3). Differences not significant (ns) by one-way ANOVA.

