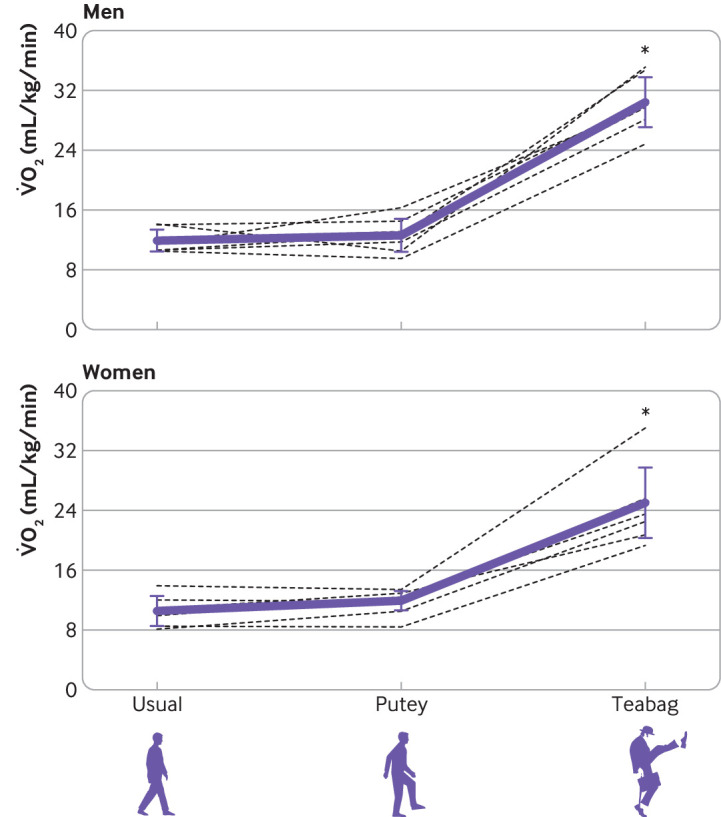
Fig 1.

Oxygen uptake (V̇O2; mL/kg/min) during participants’ usual walking and inefficient walking in men and women. Black lines are responses for individual participants. Purple line is mean±standard deviation. *Significantly greater than participants’ usual walking and the Putey walk for combined data (men and women; P<0.001)
