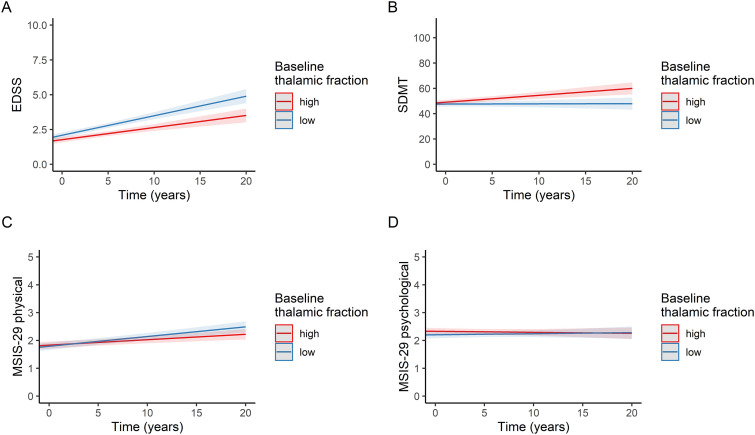
Figure 4.
Longitudinal clinical scores were categorized by baseline thalamic fractions. The straight red and blue lines are fitted from linear mixed-effects models and represent individuals with “high” and “low” baseline thalamic fractions, respectively. The shaded red and blue areas represent 95% confidence intervals. (a) EDSS, (b) SDMT, (c) MSIS-29 physical, (d) MSIS-29 psychological. Abbreviations: EDSS, expanded disability status scale; MSIS-29, multiple sclerosis impact scale 29; SDMT, symbol digit modalities test.

