
Extended Data Fig. 3: Distribution of PD-L1 expression in the immune and tumor cell compartments in pre-treatment tumor tissues of responders compared to non-responders.
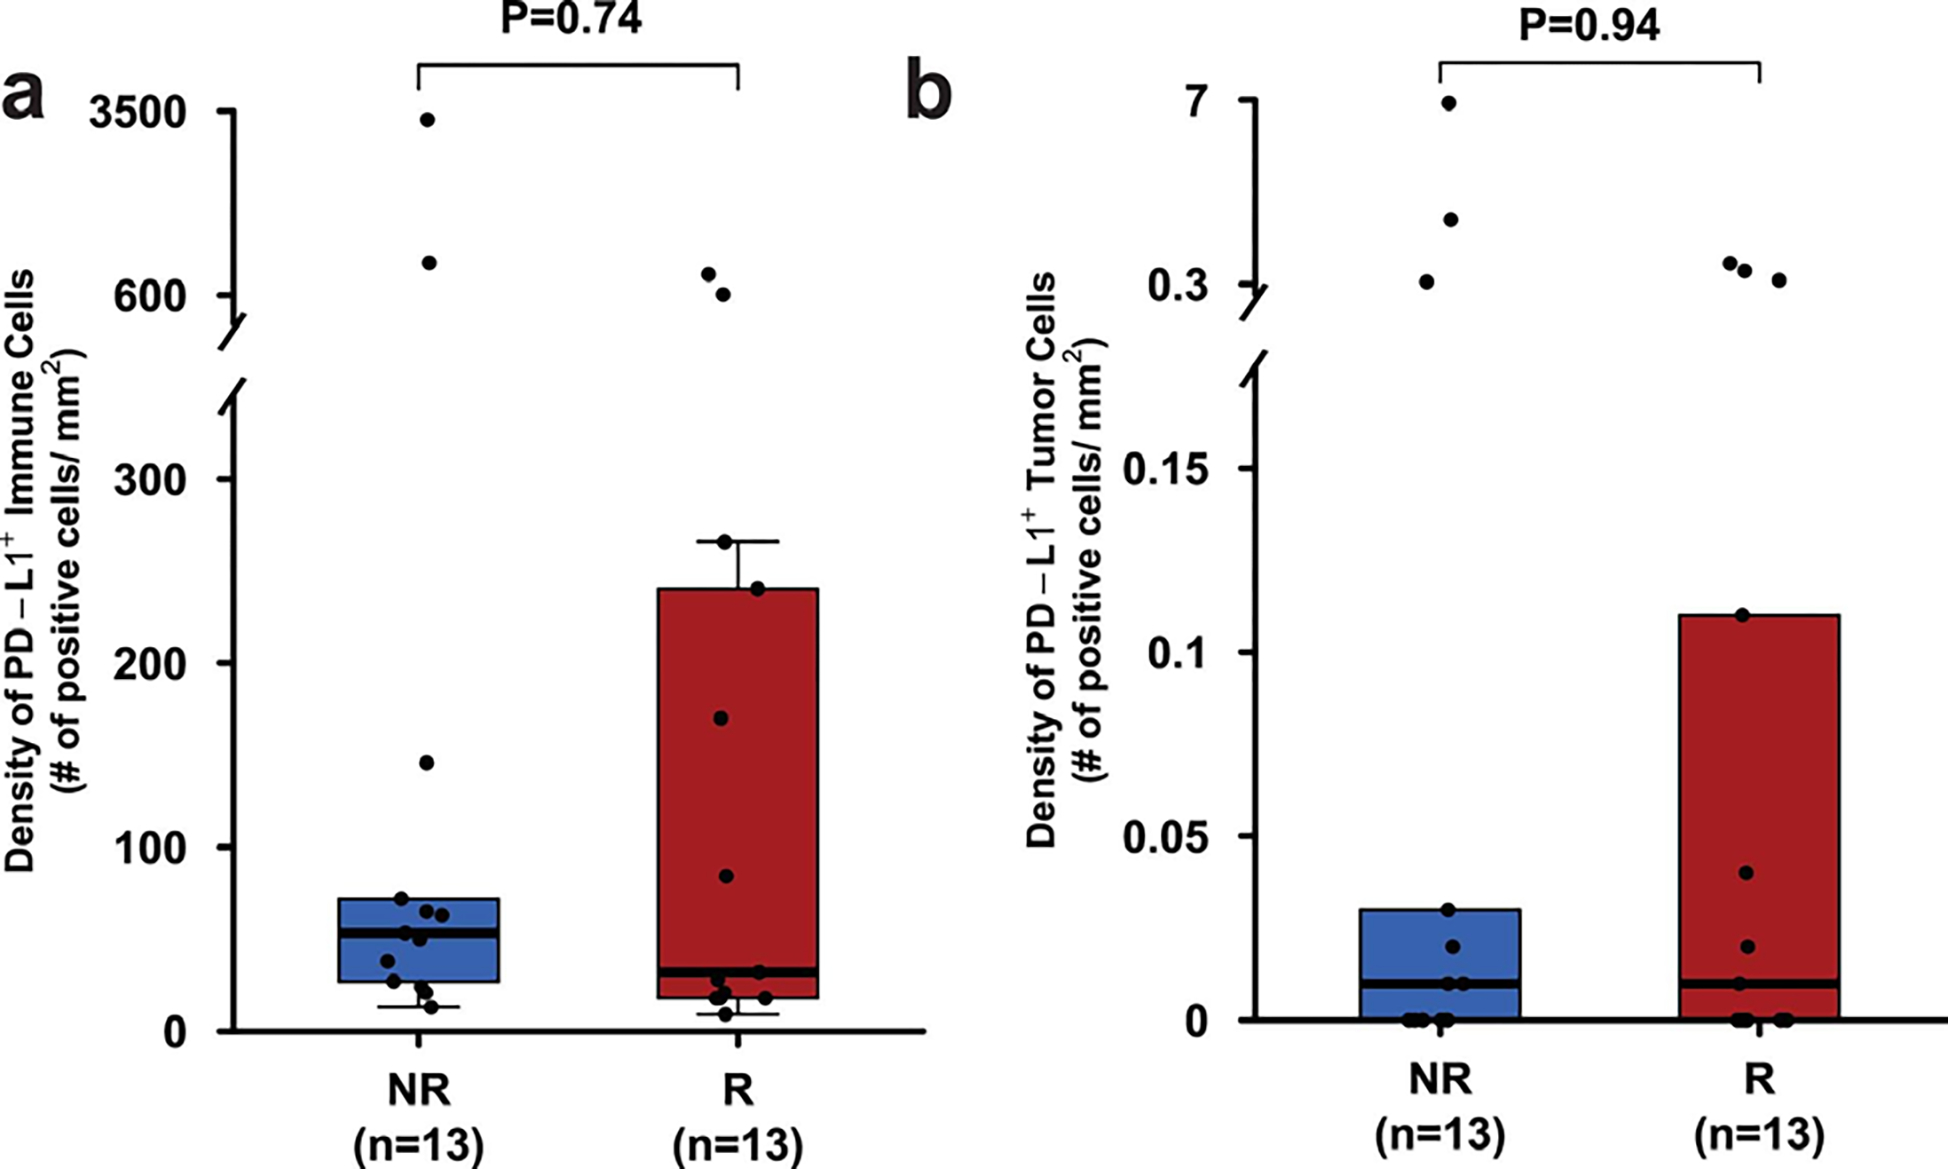
a. Box plot showing density of immune cells expressing PD-L1 in pre-treatment tumor tissue samples from responders (R, n = 13, red) and non-responders (NR, n = 13, blue).
b. Box plot showing density of tumor cells expressing PD-L1 in pre-treatment tumor tissue samples from responders (R, n = 13, red) and non-responders (NR, n = 13, blue). In the box plots of a and b, the horizontal bold line represents the median. The lower and upper hinges of the box correspond to the first and third quartiles (the 25th and 75th percentiles); the upper whisker extends from the hinge to the largest value no further than 1.5 × IQR from the hinge (where IQR is the distance between the first and third quartiles); and the lower whisker extends from the hinge to the smallest value at most 1.5 × IQR from the hinge. Statistical analysis was performed using two-sided Wilcoxon rank-sum test. P < 0.05 is considered statistically significant.