
Extended Data Fig. 5: Mutational analysis of specific genes in pre-treatment tumor tissue samples in correlation with response.
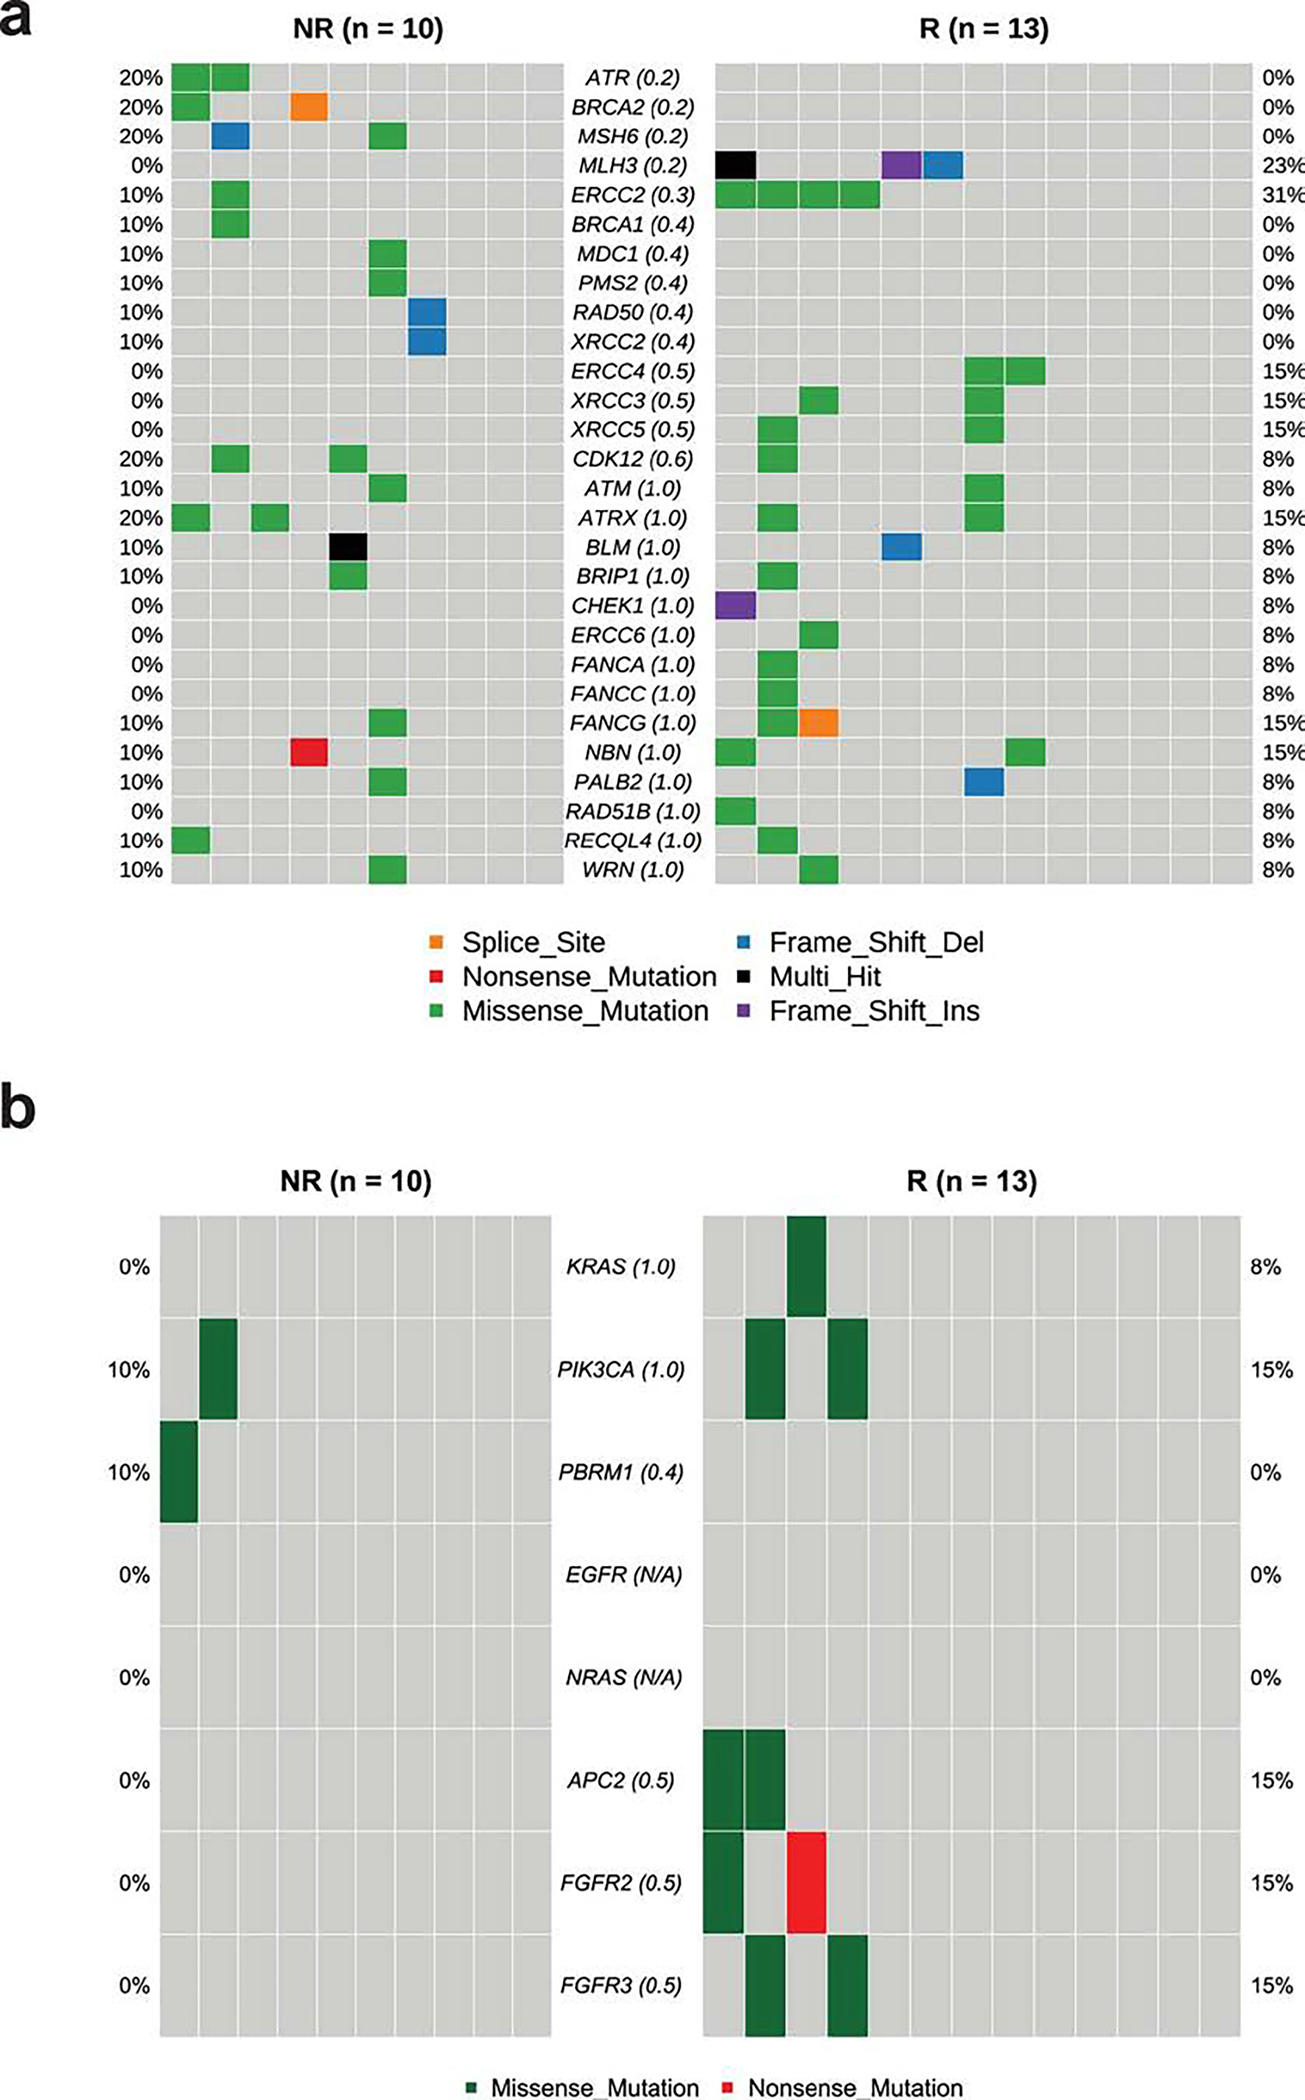
a. CoOncoplot showing mutations in DNA-damage response (DDR) genes in responders (R, n = 13, right) and non-responders (NR, n = 10, left).
b. CoOncoplot showing mutations in KRAS, PIK3CA, PBRM1, EGFR, NRAS, APC2 and FGFR genes in responders (R, n = 13, right) and non-responders (NR, n = 10, left). Each row represents a gene and the gene name is listed in the middle of the two heatmaps and their respective frequencies are listed on the left of the first heatmap (NR) and on the right of the second heatmap (R). Each column represents a patient. Each row represents a gene and the gene name is listed in the middle of the two heatmaps and their respective frequencies are listed on the left of the first heatmap (NR) and on the right of the second heatmap (R). The p-values comparing the distribution of mutations between R and NR are shown within parentheses next to each gene name. N/A denotes not applicable. The colors of rectangles in the body of the heatmap indicates different types of somatic mutations and the key identifying each mutation type is shown at the bottom. P values calculated using two-sided Fisher’s exact test.