
Extended Data Fig. 6: Biological responses in peripheral blood and tumor tissue samples after treatment with durvalumab plus tremelimumab.
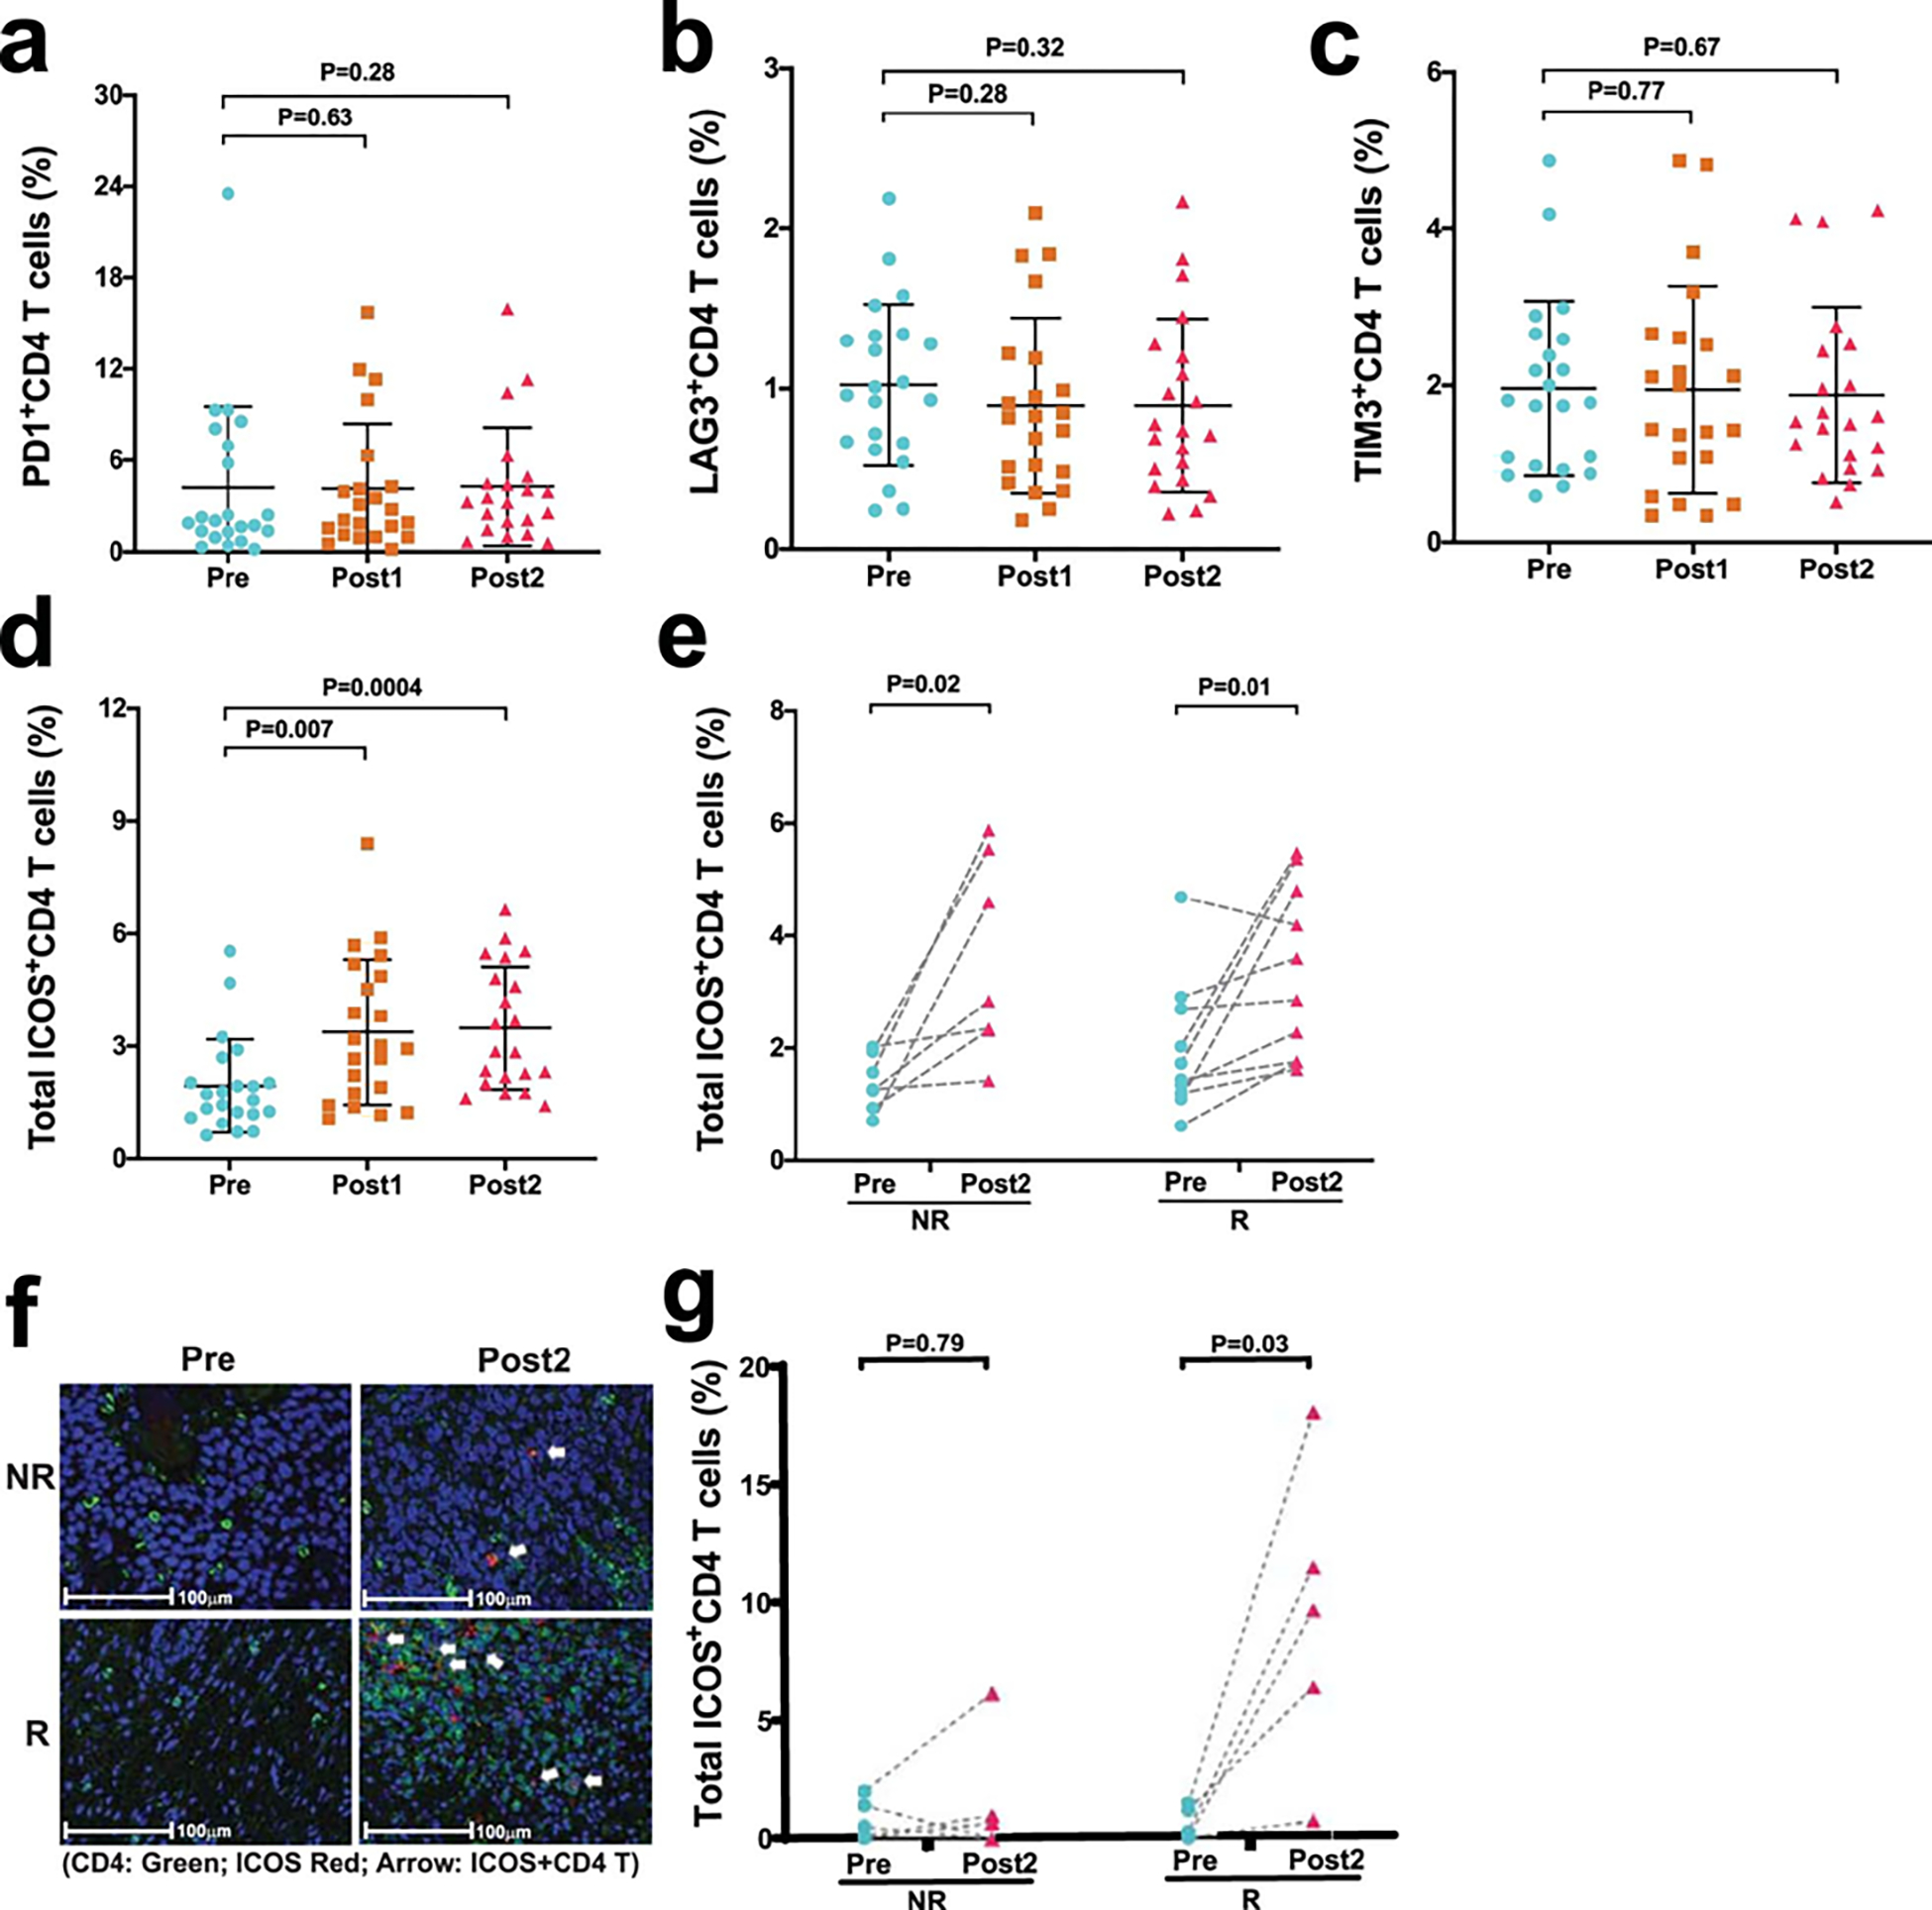
a–e. Immune profiling by CyTOF analysis was performed on peripheral blood samples collected pre- and post-treatment. a-c, Categorical scatter plots showing frequency of subsets of CD4 T cells expressing PD-1, LAG3, and TIM3 pre- and post-treatment. Pre- indicates pre-treatment (blue circles; n = 22); Post1 indicates post-treatment, dose 1 (brown squares; n = 22); Post2 indicates post-treatment, dose 2 (pink triangles; n = 21). d, Categorical scatter plot showing frequency of ICOS + CD4 T cells pre- and post-treatment. Sample numbers and color schema same as in a-c. For a-d, error bars are shown as mean±standard deviation. e, Paired dot plots showing frequency of ICOS+ CD4 T cells in matched pre- and post-treatment (Post2) blood samples. NR indicates non-responders (n = 7); R indicates responders (n = 10). P values were calculated using the two-sided Wilcoxon rank-sum test in a-d and Wilcoxon signed-rank test in e. f, Representative multiplex immunofluorescence images (magnification; 20X) from one non-responder, NR (top) and one responder, R (bottom) patient at pre-treatment, Pre (left) and post-treatment, Post2 (right) time points. The samples were stained for the following markers: ICOS (red) and CD4 (green). Nuclei were stained with DAPI (blue). White arrows point to CD4 T cells expressing ICOS. Matched pre- and post-treatment samples from 10 patients (R = 5 and NR = 5) had similar analyses completed with corresponding images that were used to generate the data in g. g, Paired dot plots showing percentage of ICOS+CD4 T cells in matched pre- (blue circles) and post- (pink triangles) treatment tumor tissue samples from non-responders, NR (n = 5) and responders, R (n = 5). P values were calculated using the two-sided Wilcoxon rank-sum test. P < 0.05 is considered statistically significant.