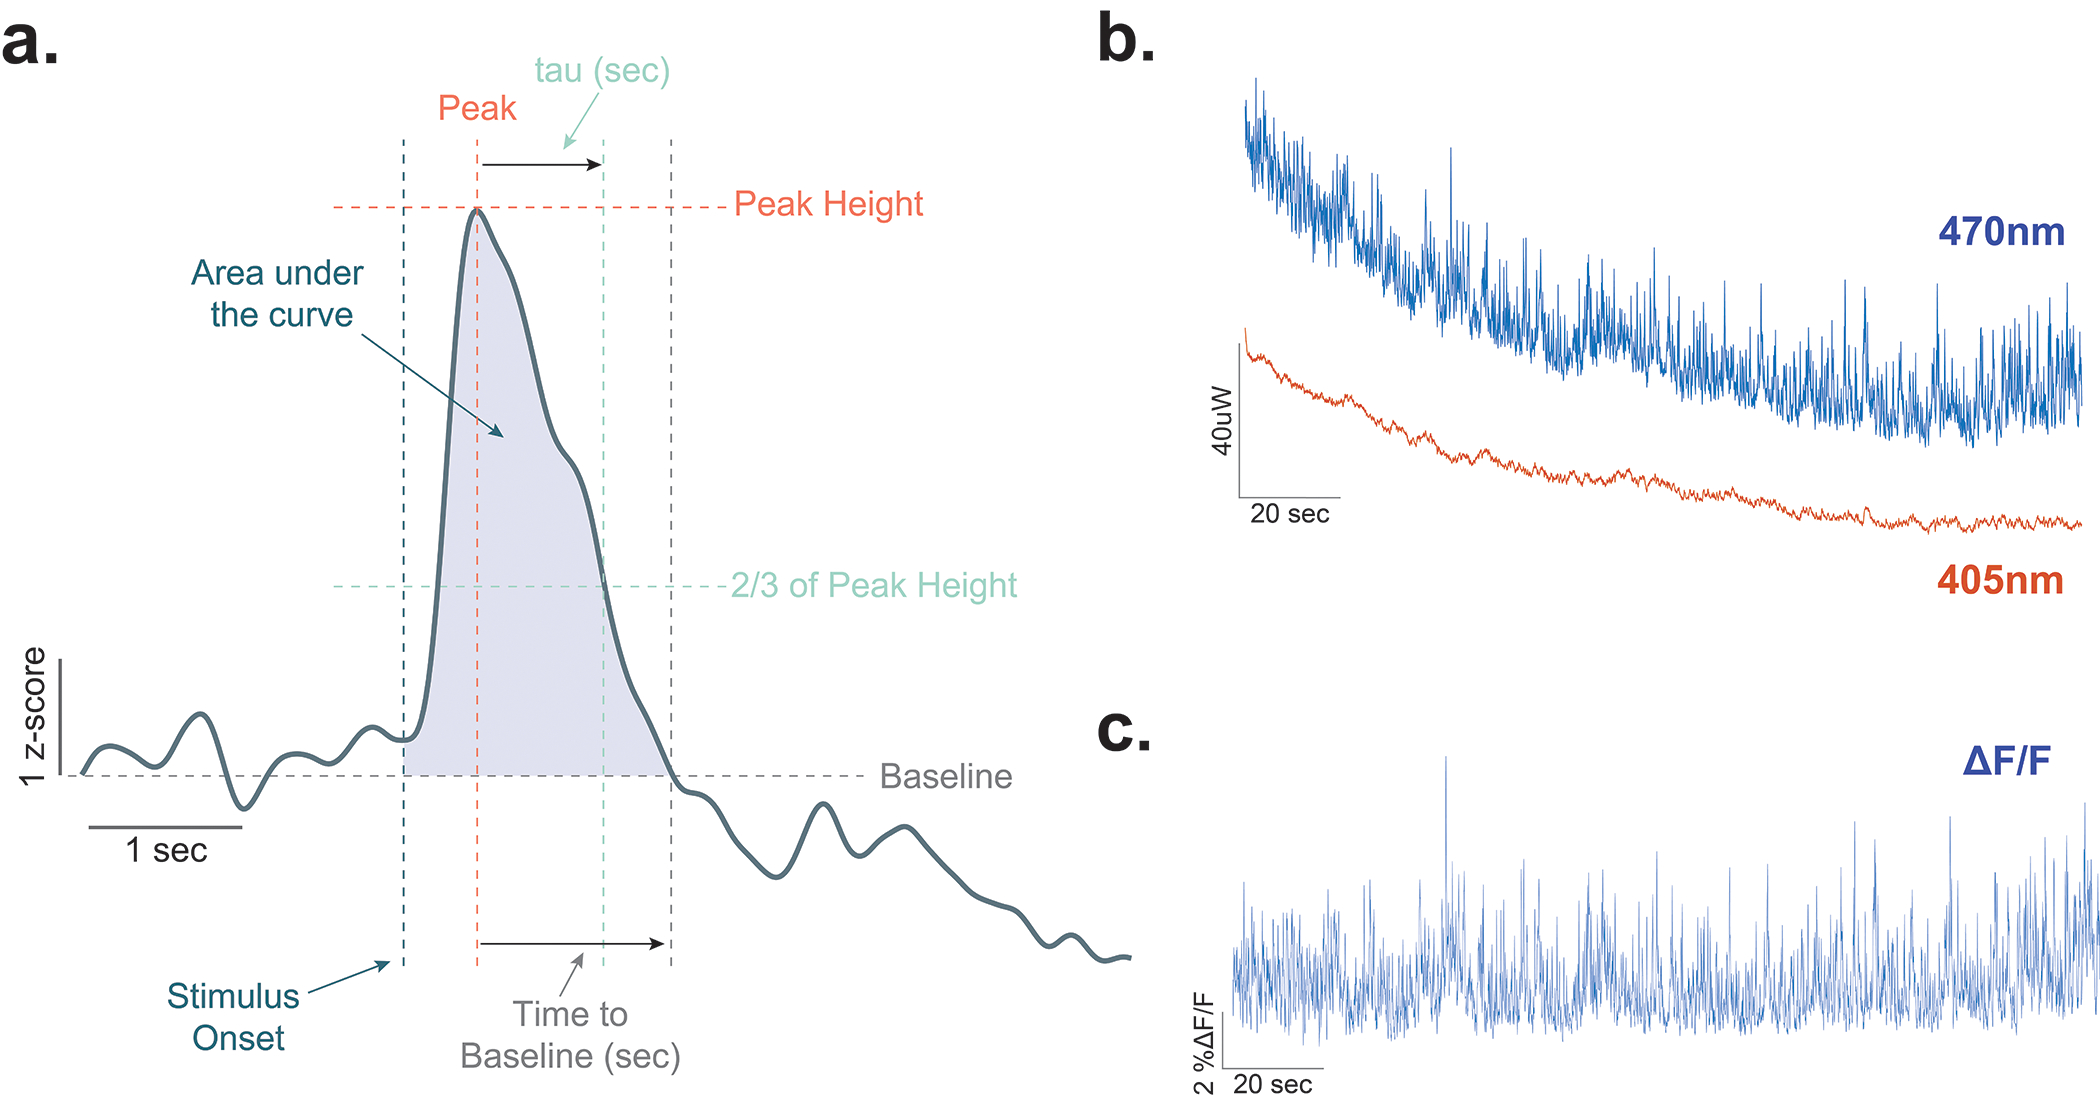
Extended Data Fig. 1. Analysis of dopamine dynamics using fiber photometry.

(a) Diagram showing the methods used for calculating area under the curve, peak height, time to baseline, and tau. These analyses have been used extensively for defining the kinetics and dynamics of dopamine signals previously (Yorgason et al., 2012). Area under the curve (AUC) is the total area from stimulus onset to the return to baseline. Peak height is the maximal amount of dopamine that is evoked by the stimulus over the entire trace. Time to baseline is the time in seconds that it takes for the signal to return to baseline following the peak. Tau is the time it takes to return to 2/3 of peak height. (b) Representative traces for 470nm excitation (dLight) and 405nm excitation (isosbestic control) channels in an individual animal at baseline. (c) Representative ΔF/F trace showing dopamine transients in the nucleus accumbens core.
