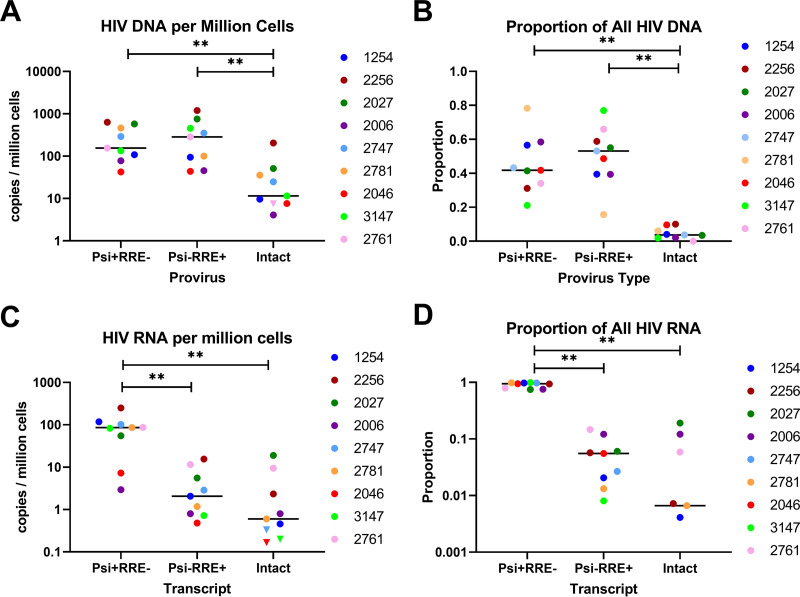
FIG 2.
Levels and proportions of defective and intact HIV DNA and RNA. RNA and DNA were extracted in parallel from replicate dilutions of peripheral CD4+ T cells from 9 ART-suppressed individuals. Average levels (A) and proportions (B) of defective and intact HIV DNA were measured by ddPCR using the IPDA. Defective and intact HIV RNA levels (C) and proportions (D) were measured by dd-RT-PCR using the IVRA. Each color represents a different individual. Samples in which intact HIV DNA or RNA was not detected were assigned a maximum value (inverted triangles) based on 1 copy divided by the total cell equivalents analyzed across all cell replicates. Bars indicate the medians. ** indicates P < 0.005 (Wilcoxon signed-rank test).

