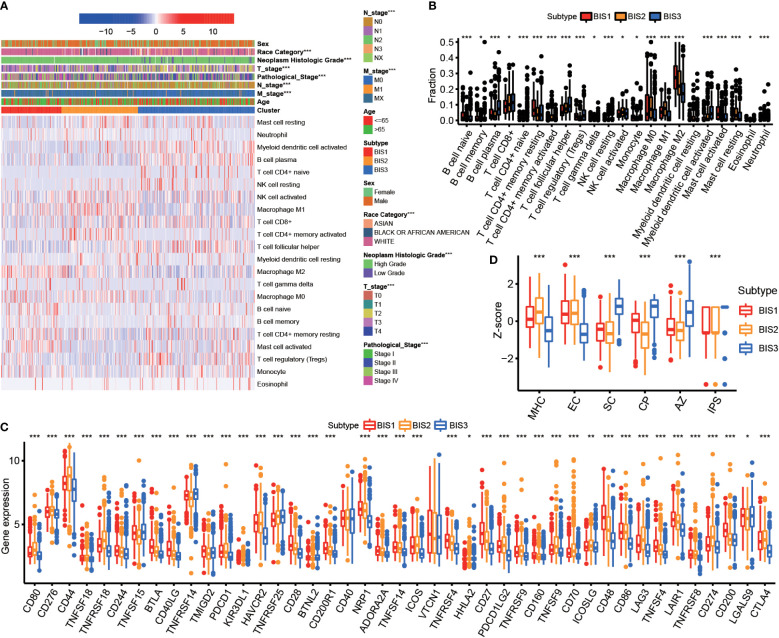
Figure 5.
Immune characteristics of three subtypes. (A) Heatmap of immune cell fraction among three subtypes in TCGA BLCA cohort. (B) Boxplot of immune cell fraction among three subtypes in TCGA BLCA cohort. (C) Immune checkpoint of three subtypes in Meta cohort. (D) Immunophenogram for the visualization of the parameters determining immunogenicity. Boxplot showed the immune score of three subtypes in TCGA BLCA cohort (MHC, major histocompatibility complex-related molecules; EC, effector cells; SC, suppressor cells; CP, checkpoints or immunomodulators; AZ, averaged z-score; IPS, immunophenoscore). *P < 0.05, **P < 0.01, ***P < 0.001.

