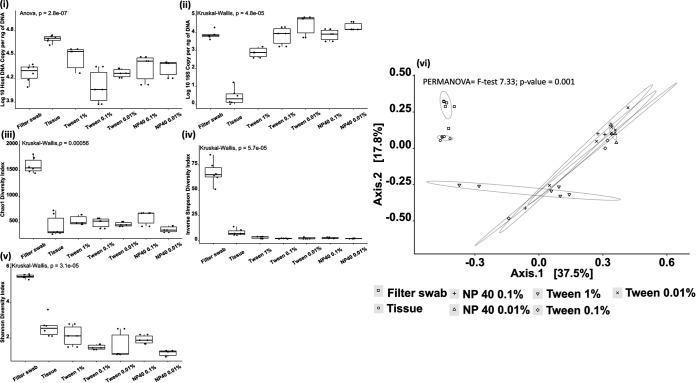
FIG 1.
Comparison of a range of sample approaches on fish gills. (i and ii) Host DNA (i) and bacterial 16S rRNA (ii) were measured using Abs-qPCR, with significantly more host material and significantly fewer 16S copies in tissue compared to all other approaches (BH-corrected P, 0.00002 to 0.009). (iii, iv, and v) Chao1 (iii), inverse Simpson (iv), and Shannon diversity (v) indices were calculated based upon the V4 region obtained by 16S amplicon sequencing. For each index metric, significantly higher values were recorded for the filter swabs versus other approaches (BH-corrected P, 0.008 to 0.045). A PCoA plot based on a Bray-Curtis similarity matrix of microbial communities (iv) comparing groups using PERMANOVA showed significant changes in grouping (F = 7.33, P = 0.001). Circles enclosing data points are intended to be visual guides.

