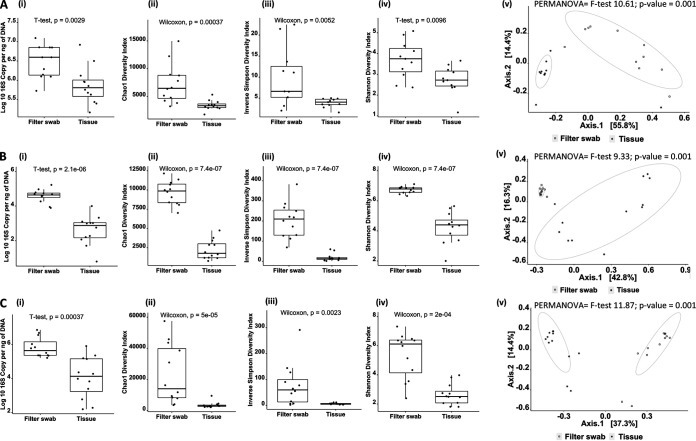
FIG 2.
Comparison of filter swabs versus gill tissue as a sampling approach in three different fish species: Mugil capito (gray mullet) (A), Oreochromis niloticus (Nile tilapia) (B), and Salmo salar (Atlantic salmon) (C). Column (i) reports the copy number of 16S per nanogram of DNA, measured using Abs-qPCR. Columns (ii) to (iv) show the Chao1, inverse Simpson, and Shannon diversity index results obtained from sequencing the V4 region of the 16S rRNA subunit with pairwise comparison values (for nonnormal distribution, Wilcoxon test; for normal distribution, t test). Colum (v) shows the PCoA plot based on a Bray-Curtis similarity matrix of microbial communities for each comparison and overall PERMANOVA results. Circles enclosing data points are intended to be visual guides.

