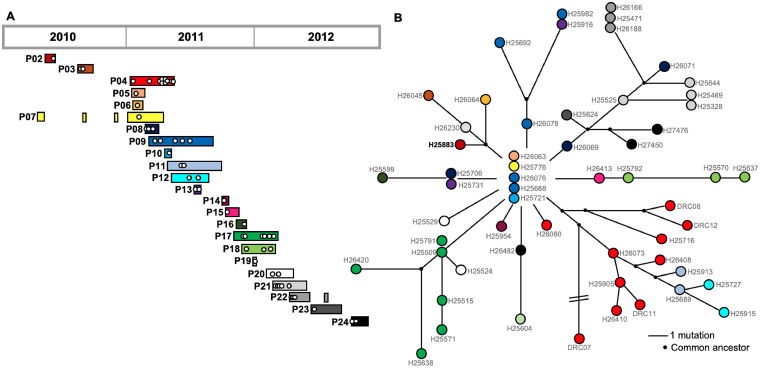
FIG 1.
Population structure of P. aeruginosa isolates from an ICU outbreak of infection. (A) P. aeruginosa isolates from a lineage of ST1076 were collected from 23 infected patients during the outbreak in the burn ICU (2010 to 2012). Patient 01 (P01) was not included as the ST1076 isolate was only distantly related to those from the outbreak. Each white circle represents a single isolate. Bars indicate patient time in the ICU (adapted from reference 25). (B) Population structure was inferred from whole-genome sequencing data (Table S2) to create a minimum spanning tree. Sequence reads were mapped to the complete genome of H25883 (in bold font). A common ancestor was inferred when subbranches had a shared mutation. The color of each circle corresponds to the patient shown in panel A.

