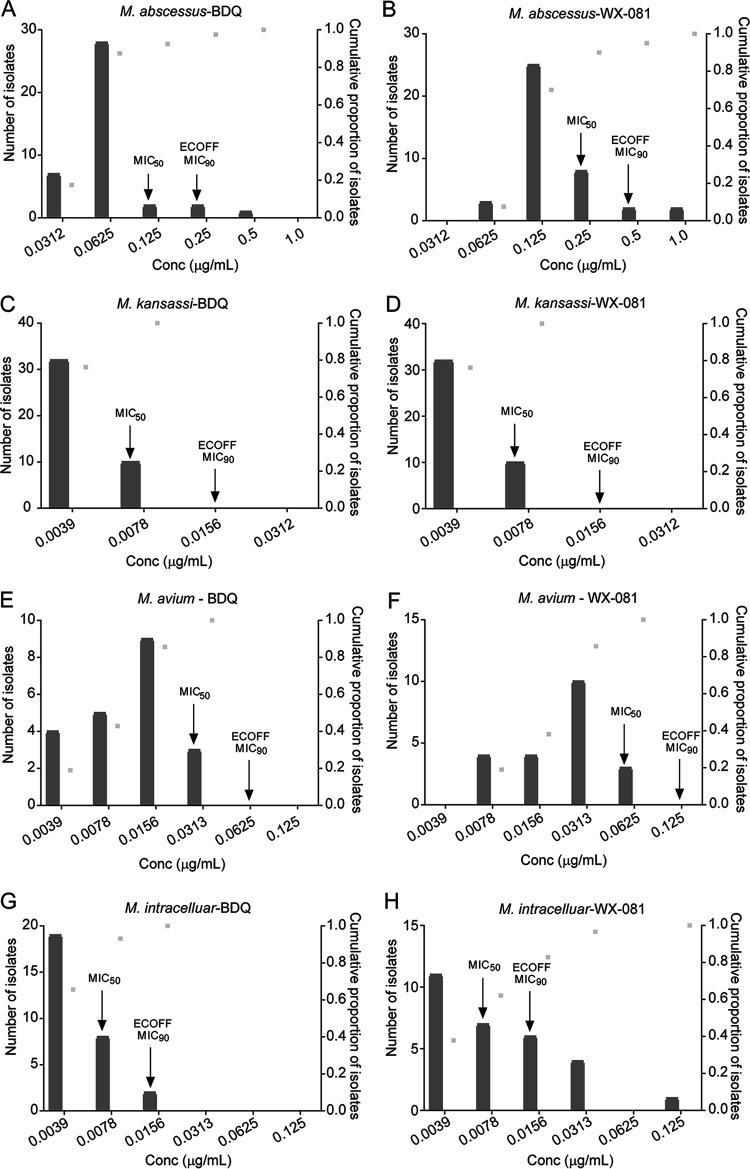
FIG 1.
The MIC distributions of BDQ and WX-081 against the four most prevalent NTM species. (A) BDQ MIC distribution for M. abscessus. (B) WX-081 MIC distribution for M. abscessus. (C) BDQ MIC distribution for M. kansassi. (D) WX-081 MIC distribution for M. kansassi. (E) BDQ MIC distribution for M. avium. (F) WX-081 MIC distribution for M. avium. (G) BDQ MIC distribution for M. intracelluare. (H) WX-081 MIC distribution for M. intracelluare. Light gray dots represent the cumulative frequency of strains as MIC values change. The bars represent the number of strains corresponding to MIC values.

