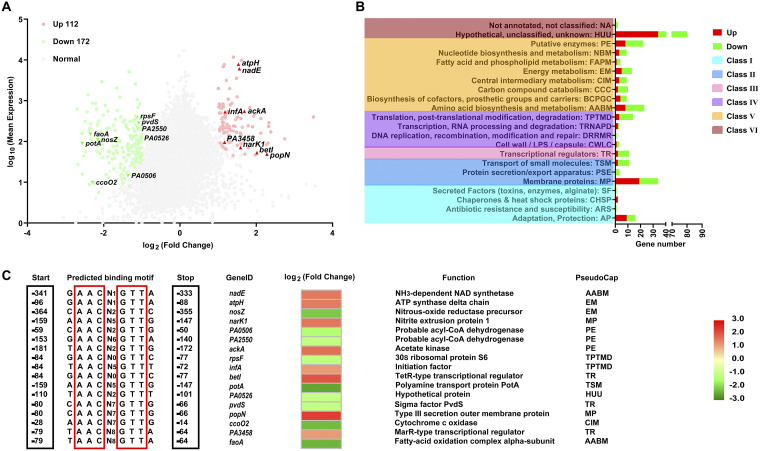
FIG 5.
Predicted LfsT-dependent genes and binding sites in the genome of P. aeruginosa P8W after RNA-seq. (A) Volcano plot of the transcriptome data (P8D versus P8W). Significantly differentially expressed genes (DEGs) (log2 fold change of ≥1; FDR of ≤0.001) are indicated in red (upregulated) and green (downregulated), while others are represented by gray dots, and genes with potential LfsT binding sites upstream of the start codons are indicated (red triangles and inverted green triangles). (B) Classification of DEGs expressed in response to LfsT deficiency based on PseudoCAP categories. When a gene was assigned to different categories, the first category was selected (see Data Set S3 in the supplemental material). Red and green bars represent the numbers of upregulated and downregulated DEGs, respectively. The PseudoCAP categories were further grouped into six classes (differently colored rectangles on the left). For clarity, some categories with no assigned DEGs are not displayed. (C) Search for the motif NAACN(0,9)GTTN across promoter regions within 500 bp upstream of 113 DEGs. Seventeen genes with predicted sites in the intergenic regions are shown.

