FIG 6.
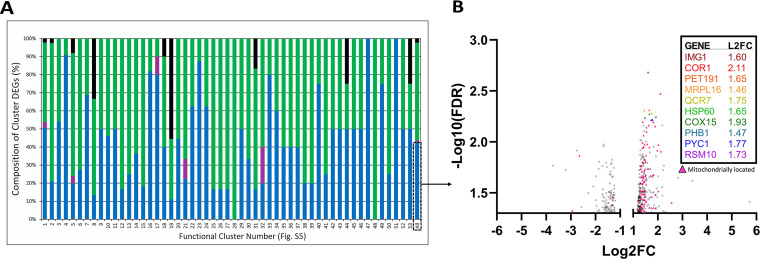
(A) Bar graph showing the gene categories within the differentially expressed gene list of S. cerevisiae (Sc) in response to consortium growth with both T. delbrueckii (Td) and L. thermotolerans (Lt). Percentages were calculated for the entire gene list (All), as well as for clusters 1 to 53. Black represents the percentage of genes common between all coculture conditions tested. Green represents the percentage of genes in common with the pairwise T. delbrueckii coculture. Purple represents the percentage of genes in common with the pairwise L. thermotolerans coculture. Blue represents the percentage of genes unique to consortium growth. (B) Volcano plot of differentially expressed genes in S. cerevisiae unique to consortium growth. Minimum −log10(FDR) of 1.3 and fold change cutoff of 1 and −1. Genes with the top 10 highest statistical significances are shown and color coded to the graph. Genes that are located in the mitochondria are represented by triangles.

