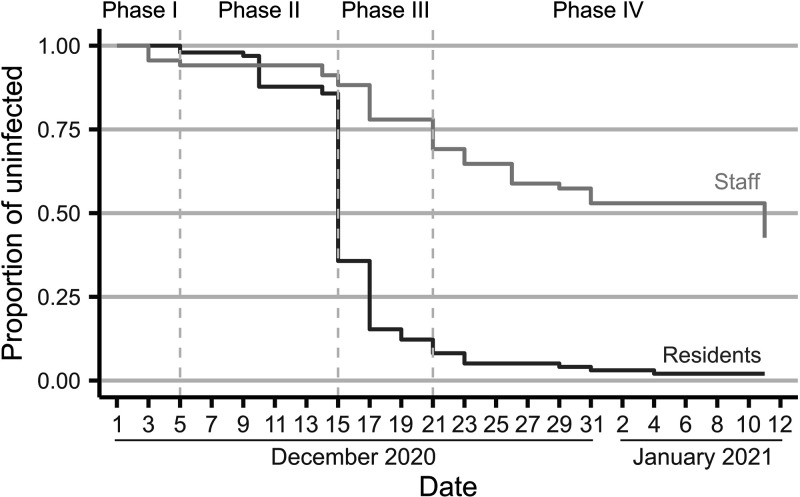
FIG 2.
Kaplan-Meier survival estimates. Each phase of the outbreak is indicated. Survival estimate curves for staff (light gray) and residents (dark gray) had parallel trajectories, with a super spreading event (phase II) resulting in a great number of cases among residents, which in turn infected staff members during the relocation period (phase III).

