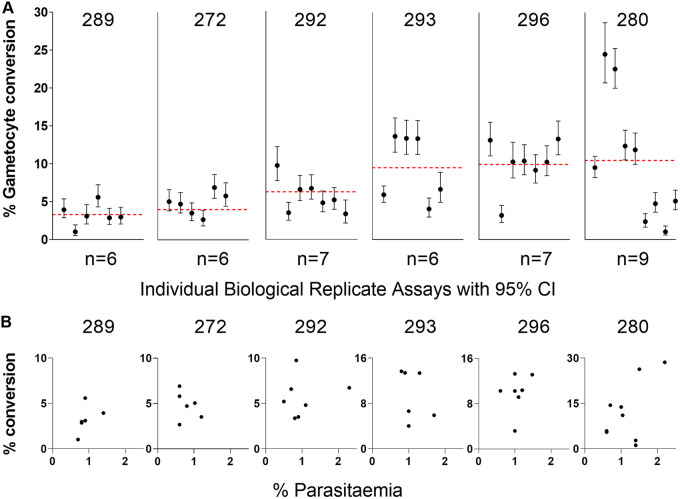
FIG 4.
Gametocyte conversion rates of six recently culture-established Ghanaian clinical isolates. These were selected for study as they are unrelated single-genotype infections, chosen from a larger number of samples from a highly endemic population that contained many multiple-genotype infections (36). (A) For each isolate, a minimum of six biological replicate assays were performed at various times after different duration of culture (specified for each replicate in Table S3 in Supplemental File 1 and ranging between 48 to 125 days overall). The conversion rate estimate from each replicate is plotted with 95% confidence intervals, while the red dotted line represents the mean across replicate assays. There were significant differences in pairwise comparisons (Mann-Whitney tests, Table S4 in Supplemental File 1), with isolate 296 having a significantly higher conversion rate than three others (isolates 272, 289, and 292), and isolate 289 having a significantly lower rate than three others (292, 293, and 296) (Table S4 in Supplemental File 1). Details and all numerical data are given in Table S3 in Supplemental File 1. (B) For each isolate, the gametocyte conversion rate of individual replicates is plotted in relation to the culture parasitemia in the previous cycle (between 0.5 and 2.5% for all experimental replicates). The 95% confidence intervals for the individual conversion rate points are not shown because they are the same as in (A). There was no systematic trend toward positive or negative correlation, except a marginally significant positive correlation for isolate 289 (P = 0.02), which may indicate slight enhancement at higher parasitemia or a chance finding due to multiple comparisons (Table 1).

