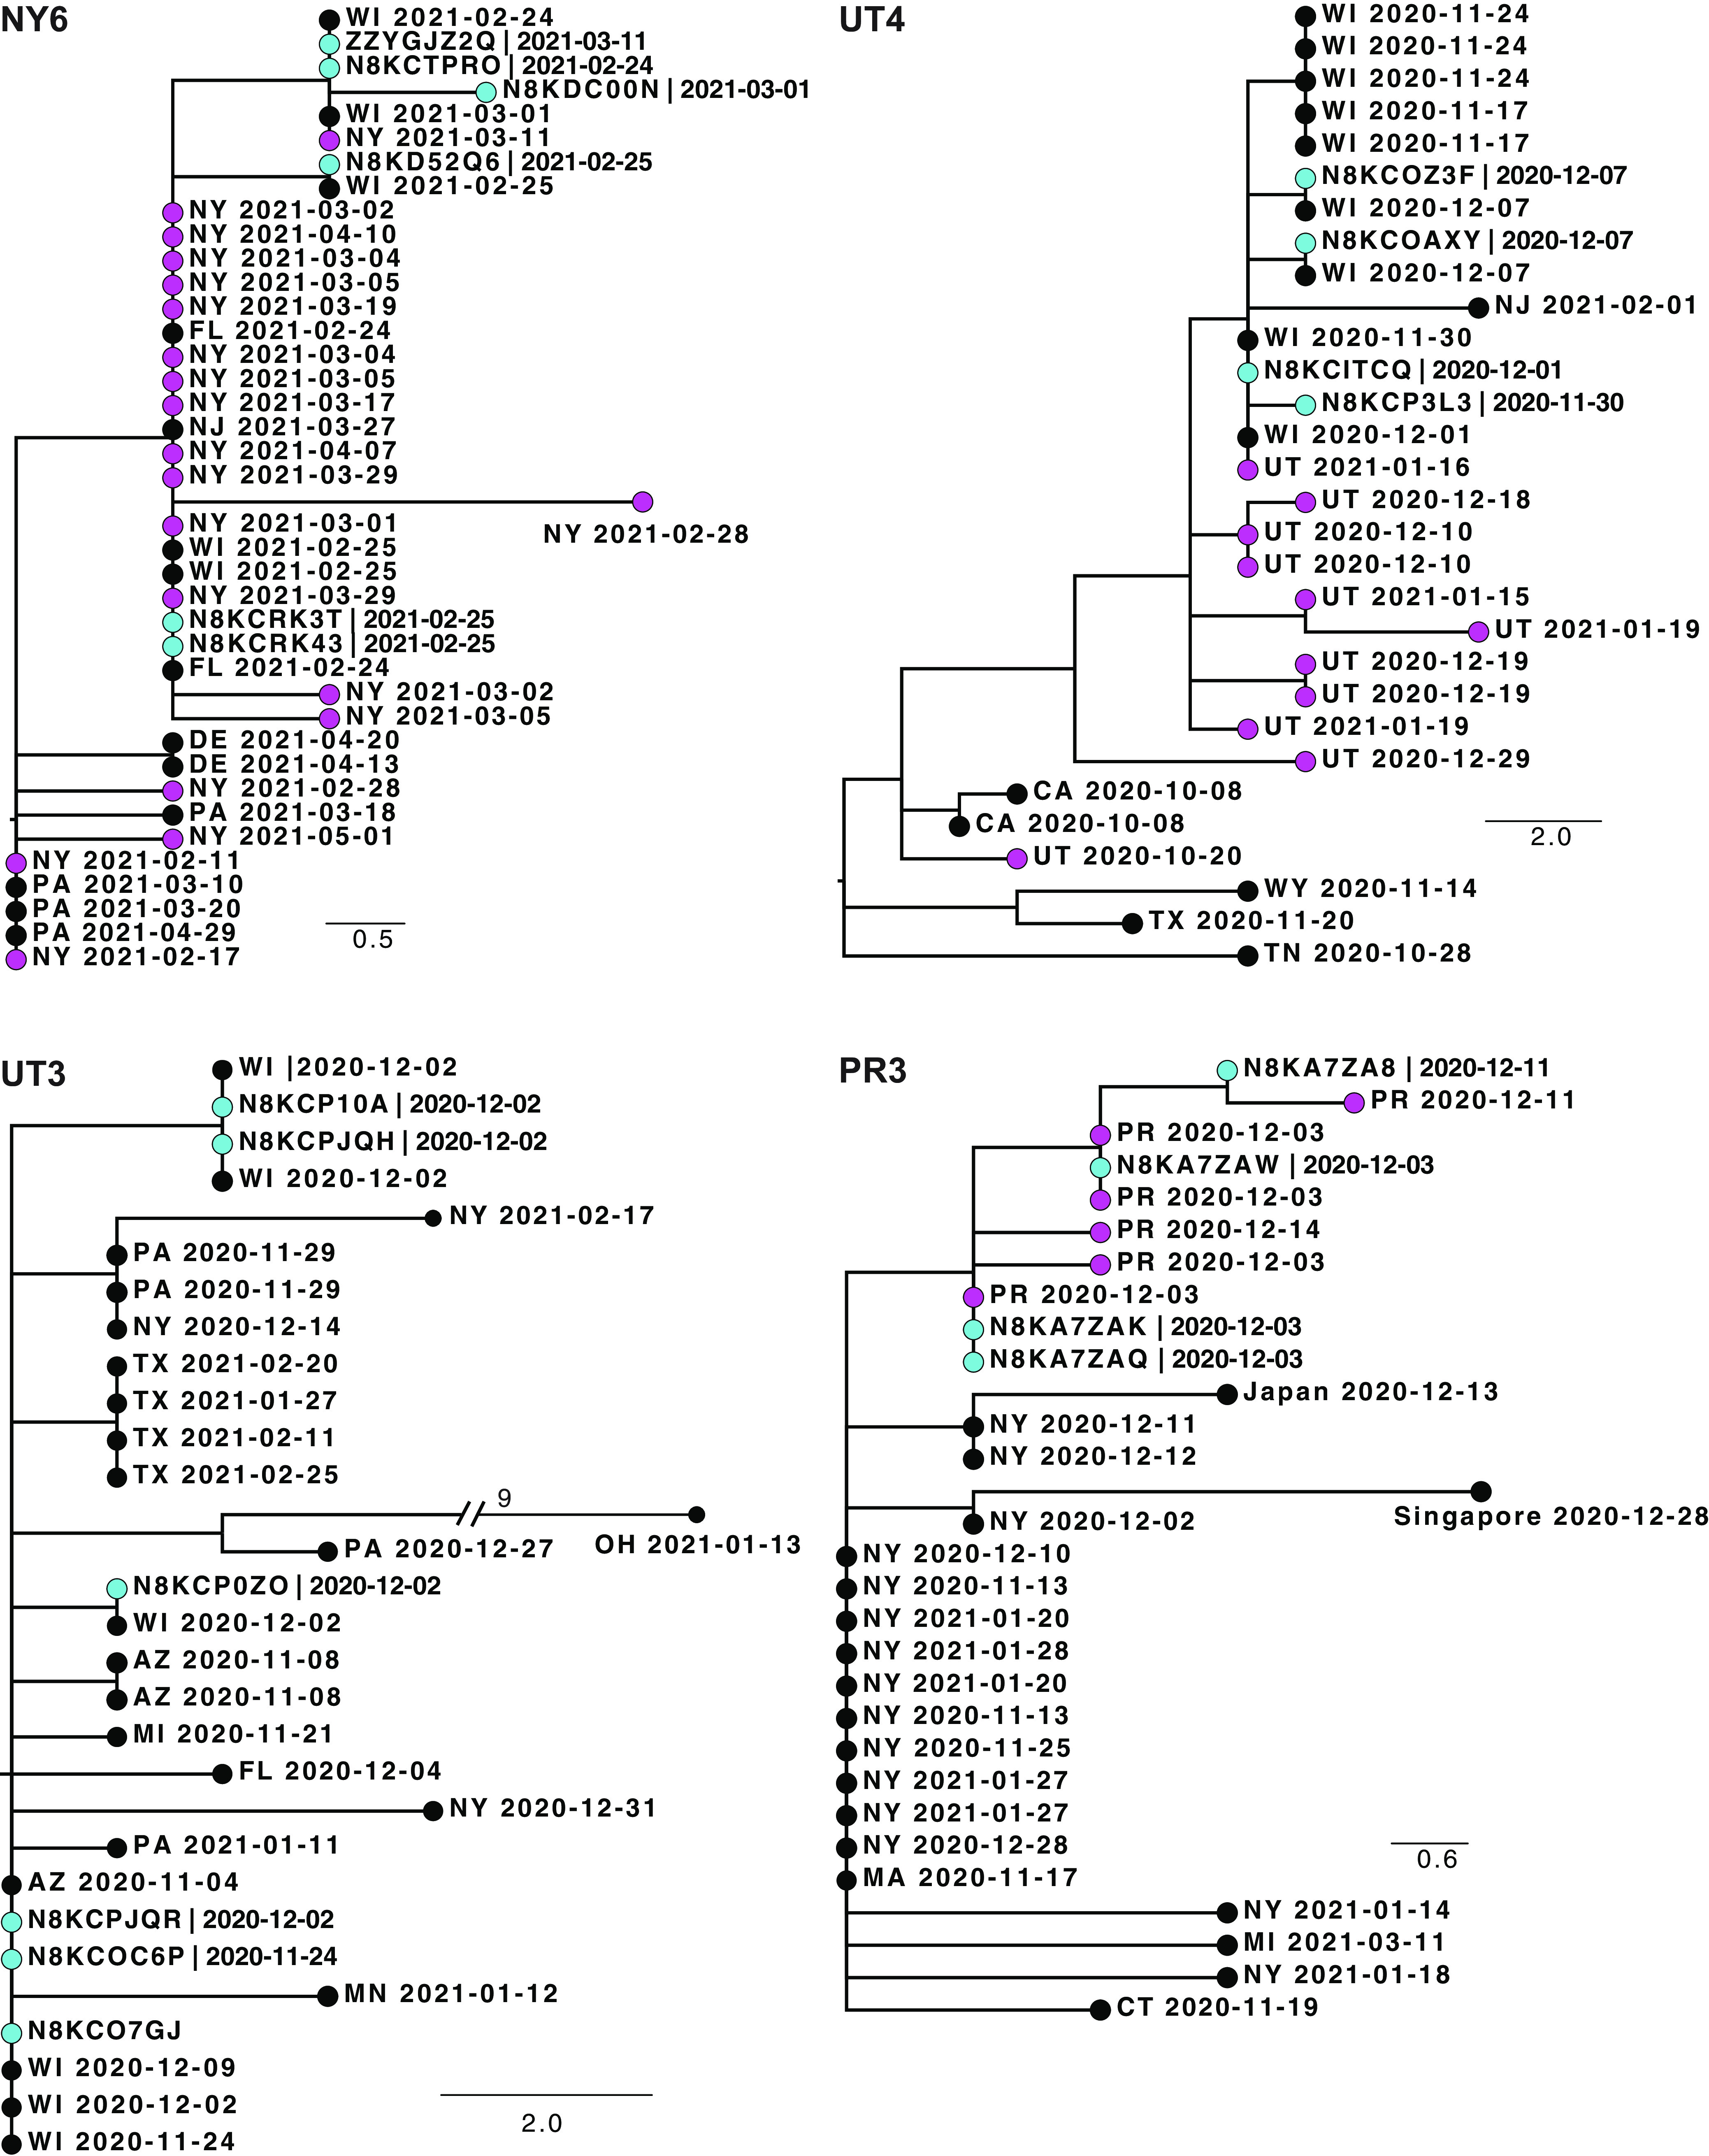
FIG 3.

Phylogenetic trees of sequences from households where participants had distinct consensus sequences. Shown are four representative trees. Trees from 7 other households are shown in Fig. S5. Each tree is labeled with the household identifier (NY, New York; UT, Utah; PR, Puerto Rico). The tips of household sequences are colored cyan and those from the same state or territory (2-letter abbreviation) are colored magenta. All other tips are colored black. The collection date for each sample is indicated. Genetic distance is represented by the bar and corresponds to one mutation.
