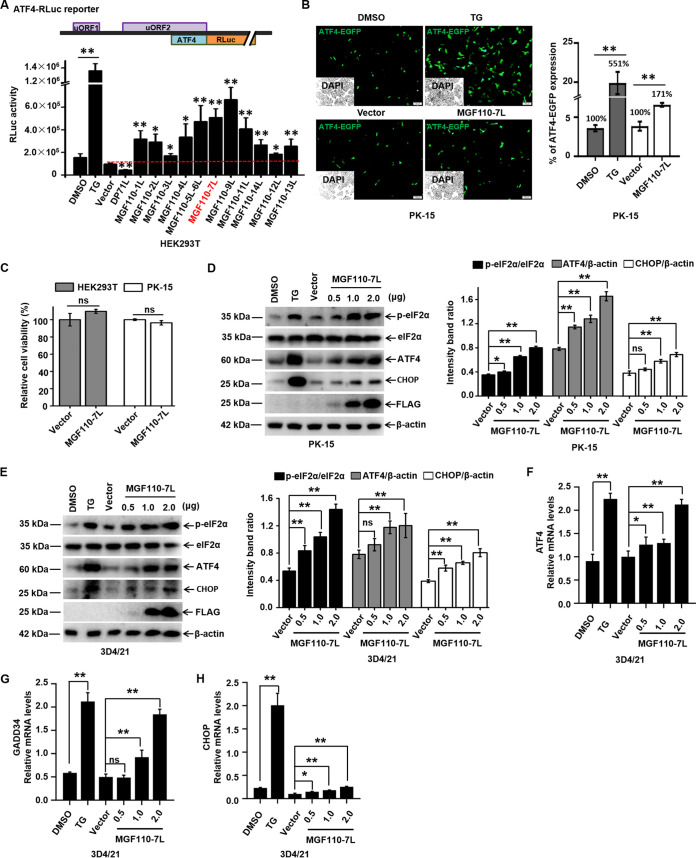
FIG 1.
ASFV MGF110-7L triggers the eIF2α signaling pathway. (A) Schematic illustration of ATF4-RLuc reporter (top). HEK293T cells were cotransfected with ATF4-RLuc reporter (0.05 μg) and an empty vector or a vector expressing different members of the MGF110 family (0.1 μg). At 24 h posttransfection, the cells were lysed, and then a luciferase assay was performed. A positive control for eIF2α phosphorylation was set by TG (1 μM) treatment for 6 h on cells transfected with ATF4-RLuc. (B) PK-15 cells were cotransfected with ATF4-EGFP reporter (0.2 μg) and FLAG vector or MGF110-7L-Flag (0.4 μg). At 24 h posttransfection, the cells were subjected to fluorescence analysis. TG was used as the positive control. Quantification of ATF4-EGFP expression was done using ImageJ software in at least 10 random fields of view with greater than 800 cells analyzed on each slide. Bar graphs on the right show the percentage of cells expressing EGFP in each group under different treatments. (C) HEK293T and PK-15 cells were transfected with an empty vector or MGF110-7L-FLAG plasmid (2 μg) for 24 h. Cell viability was assessed with CCK-8 assays. (D and E) PK-15 and 3D4/21 cells were transfected with a MGF110-7L-Flag-expressing vector with an increasing dose (0.5, 1.0, 2.0 μg) or an empty Flag vector (2.0 μg) for 24 h. TG was used as a positive control. The cells were then subjected to Western blot analysis (left). The grayscale values of the protein bands were analyzed by ImageJ (right). (F to H) 3D4/21 cells were treated as described above for panel E. RNA samples were extracted at the indicated times, and the mRNA levels of ATF4 (F), GADD34 (G), and CHOP (H) were determined by RT-qPCR analysis. The data are the means of results of three independent experiments, and error bars indicate the SD. *, P < 0.05; **, P < 0.01; ns, not significant.

