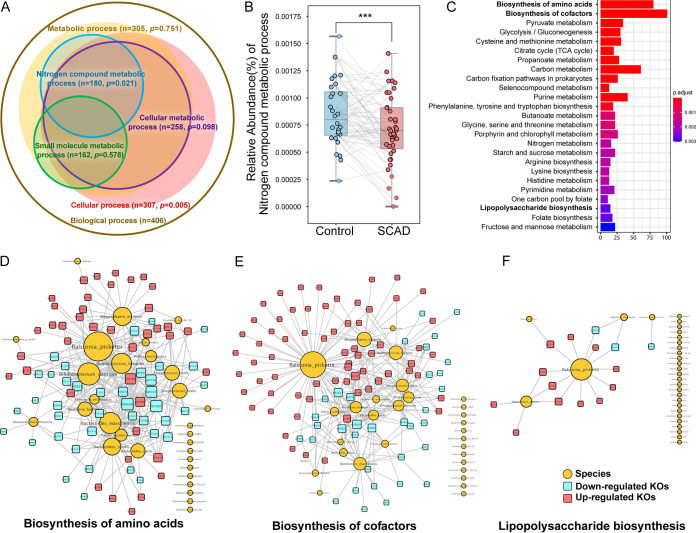
FIG 3.
Functional alteration of gut microbes in SCAD patients. (A) Key GO groups enriched by differential GO terms between the 2 groups by Fisher’s exact test. (B) Relative abundance of nitrogen compound metabolic process by GO enrichment analysis. Wilcoxon signed-rank test was used to determine the significance. ***, P < 0.001. (C) Metabolic pathways enrichment of 1371 differential KO genes (Wilcoxon signed-rank test, PFDR < 0.05) between the 2 groups based on KEGG database by clusterProfiler. (D) to (F) Associated networks constructed from differential gut microbes and their KO genes in amino acid biosynthesis, cofactors biosynthesis, and LPS biosynthesis. Yellow circulars represent differential gut microbes, and the size denotes the connected numbers of KO genes. Red squares represent upregulated differential KO genes, and blue squares represent downregulated differential KO genes.

